หน้า 1

คลิกเพื่อขยาย
JPグラフの説明が
せつめい
できるようになろう!
せつめい
できるようになろう!
ENBecome Proficient in
Describing Graphs in Japanese
Describing Graphs in Japanese
หน้า 2
คลิกเพื่อขยาย
EN AGENDA
JPしゅるい
01グラフの種類を言ってみよう
01グラフの種類を言ってみよう
EN Let's talk about types of graphs
JPグラフの変動を表現しよう
へんどうひょうげん
02
へんどうひょうげん
02
EN Let's express changes in graphs
JPいろんなグラフを見て説明しよう
せつめい
03
せつめい
03
EN Let's look at various graphs and explain them
หน้า 3

คลิกเพื่อขยาย
1
JPグラフの種類を言ってみよう
しゅるい
しゅるい
EN Let's talk about types of graphs
หน้า 4
คลิกเพื่อขยาย
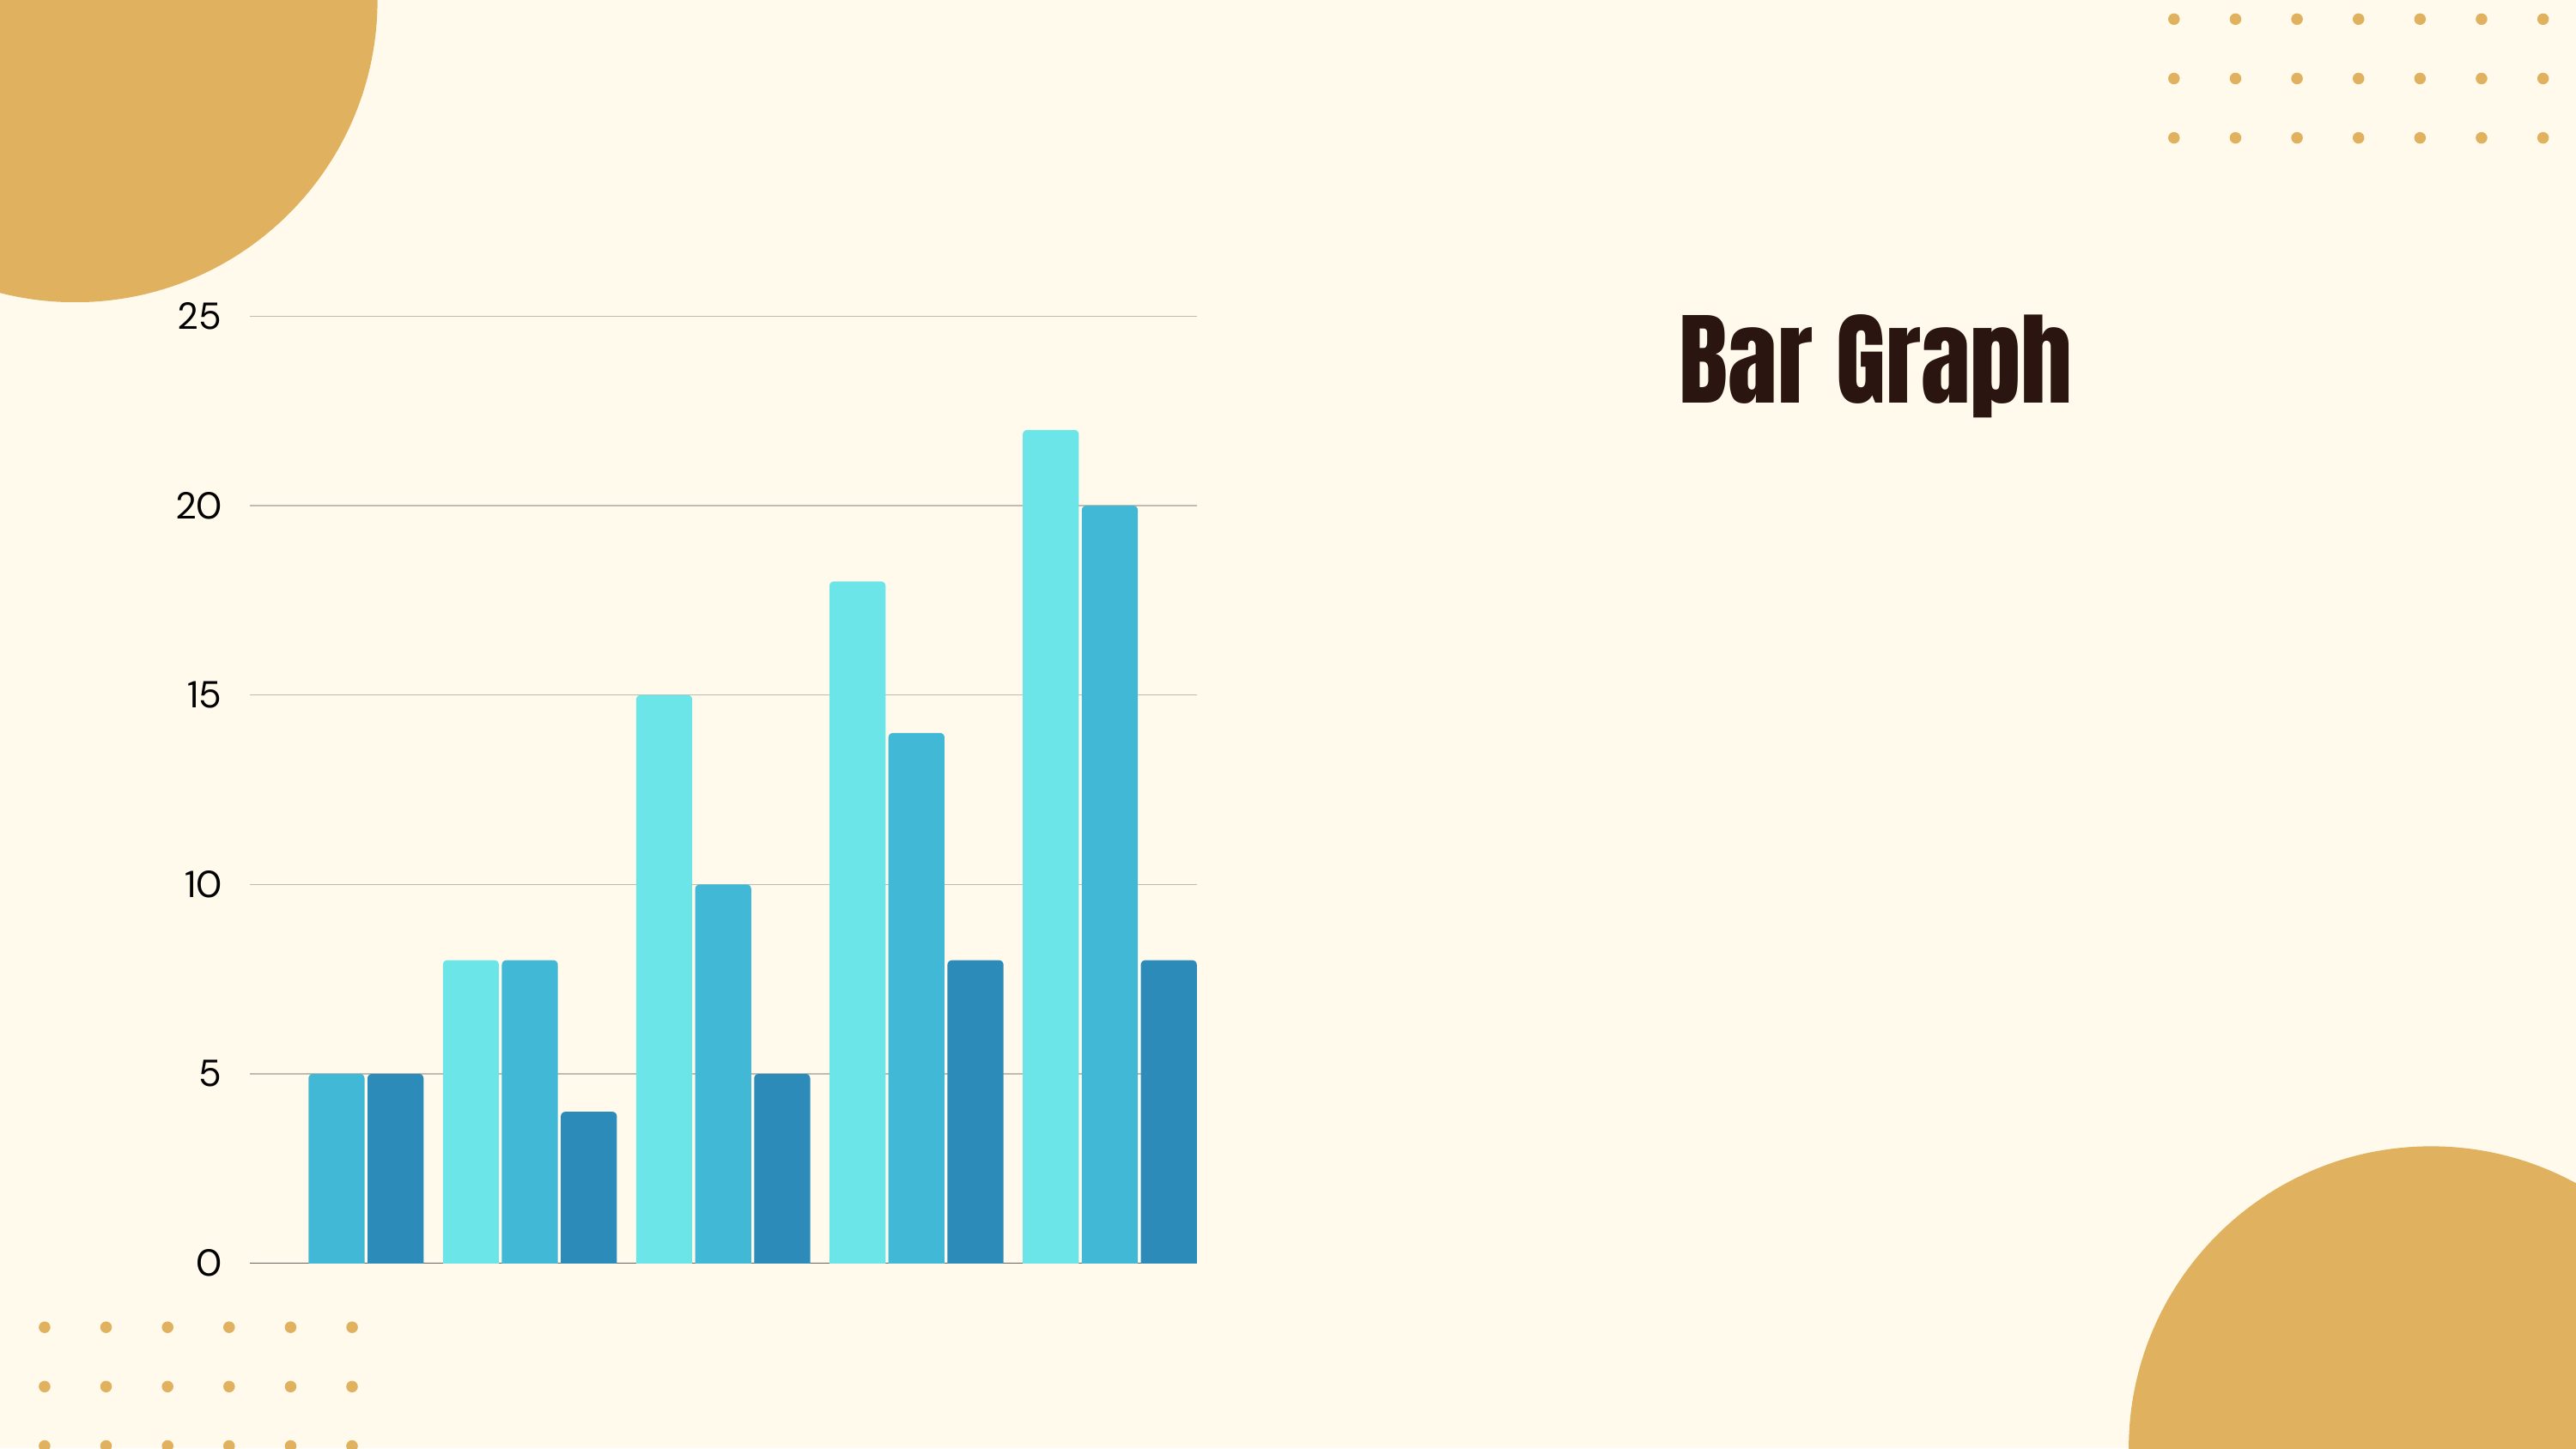
EN Bar Graph
25
20
15
10
5
0
25
20
15
10
5
0
หน้า 5
คลิกเพื่อขยาย
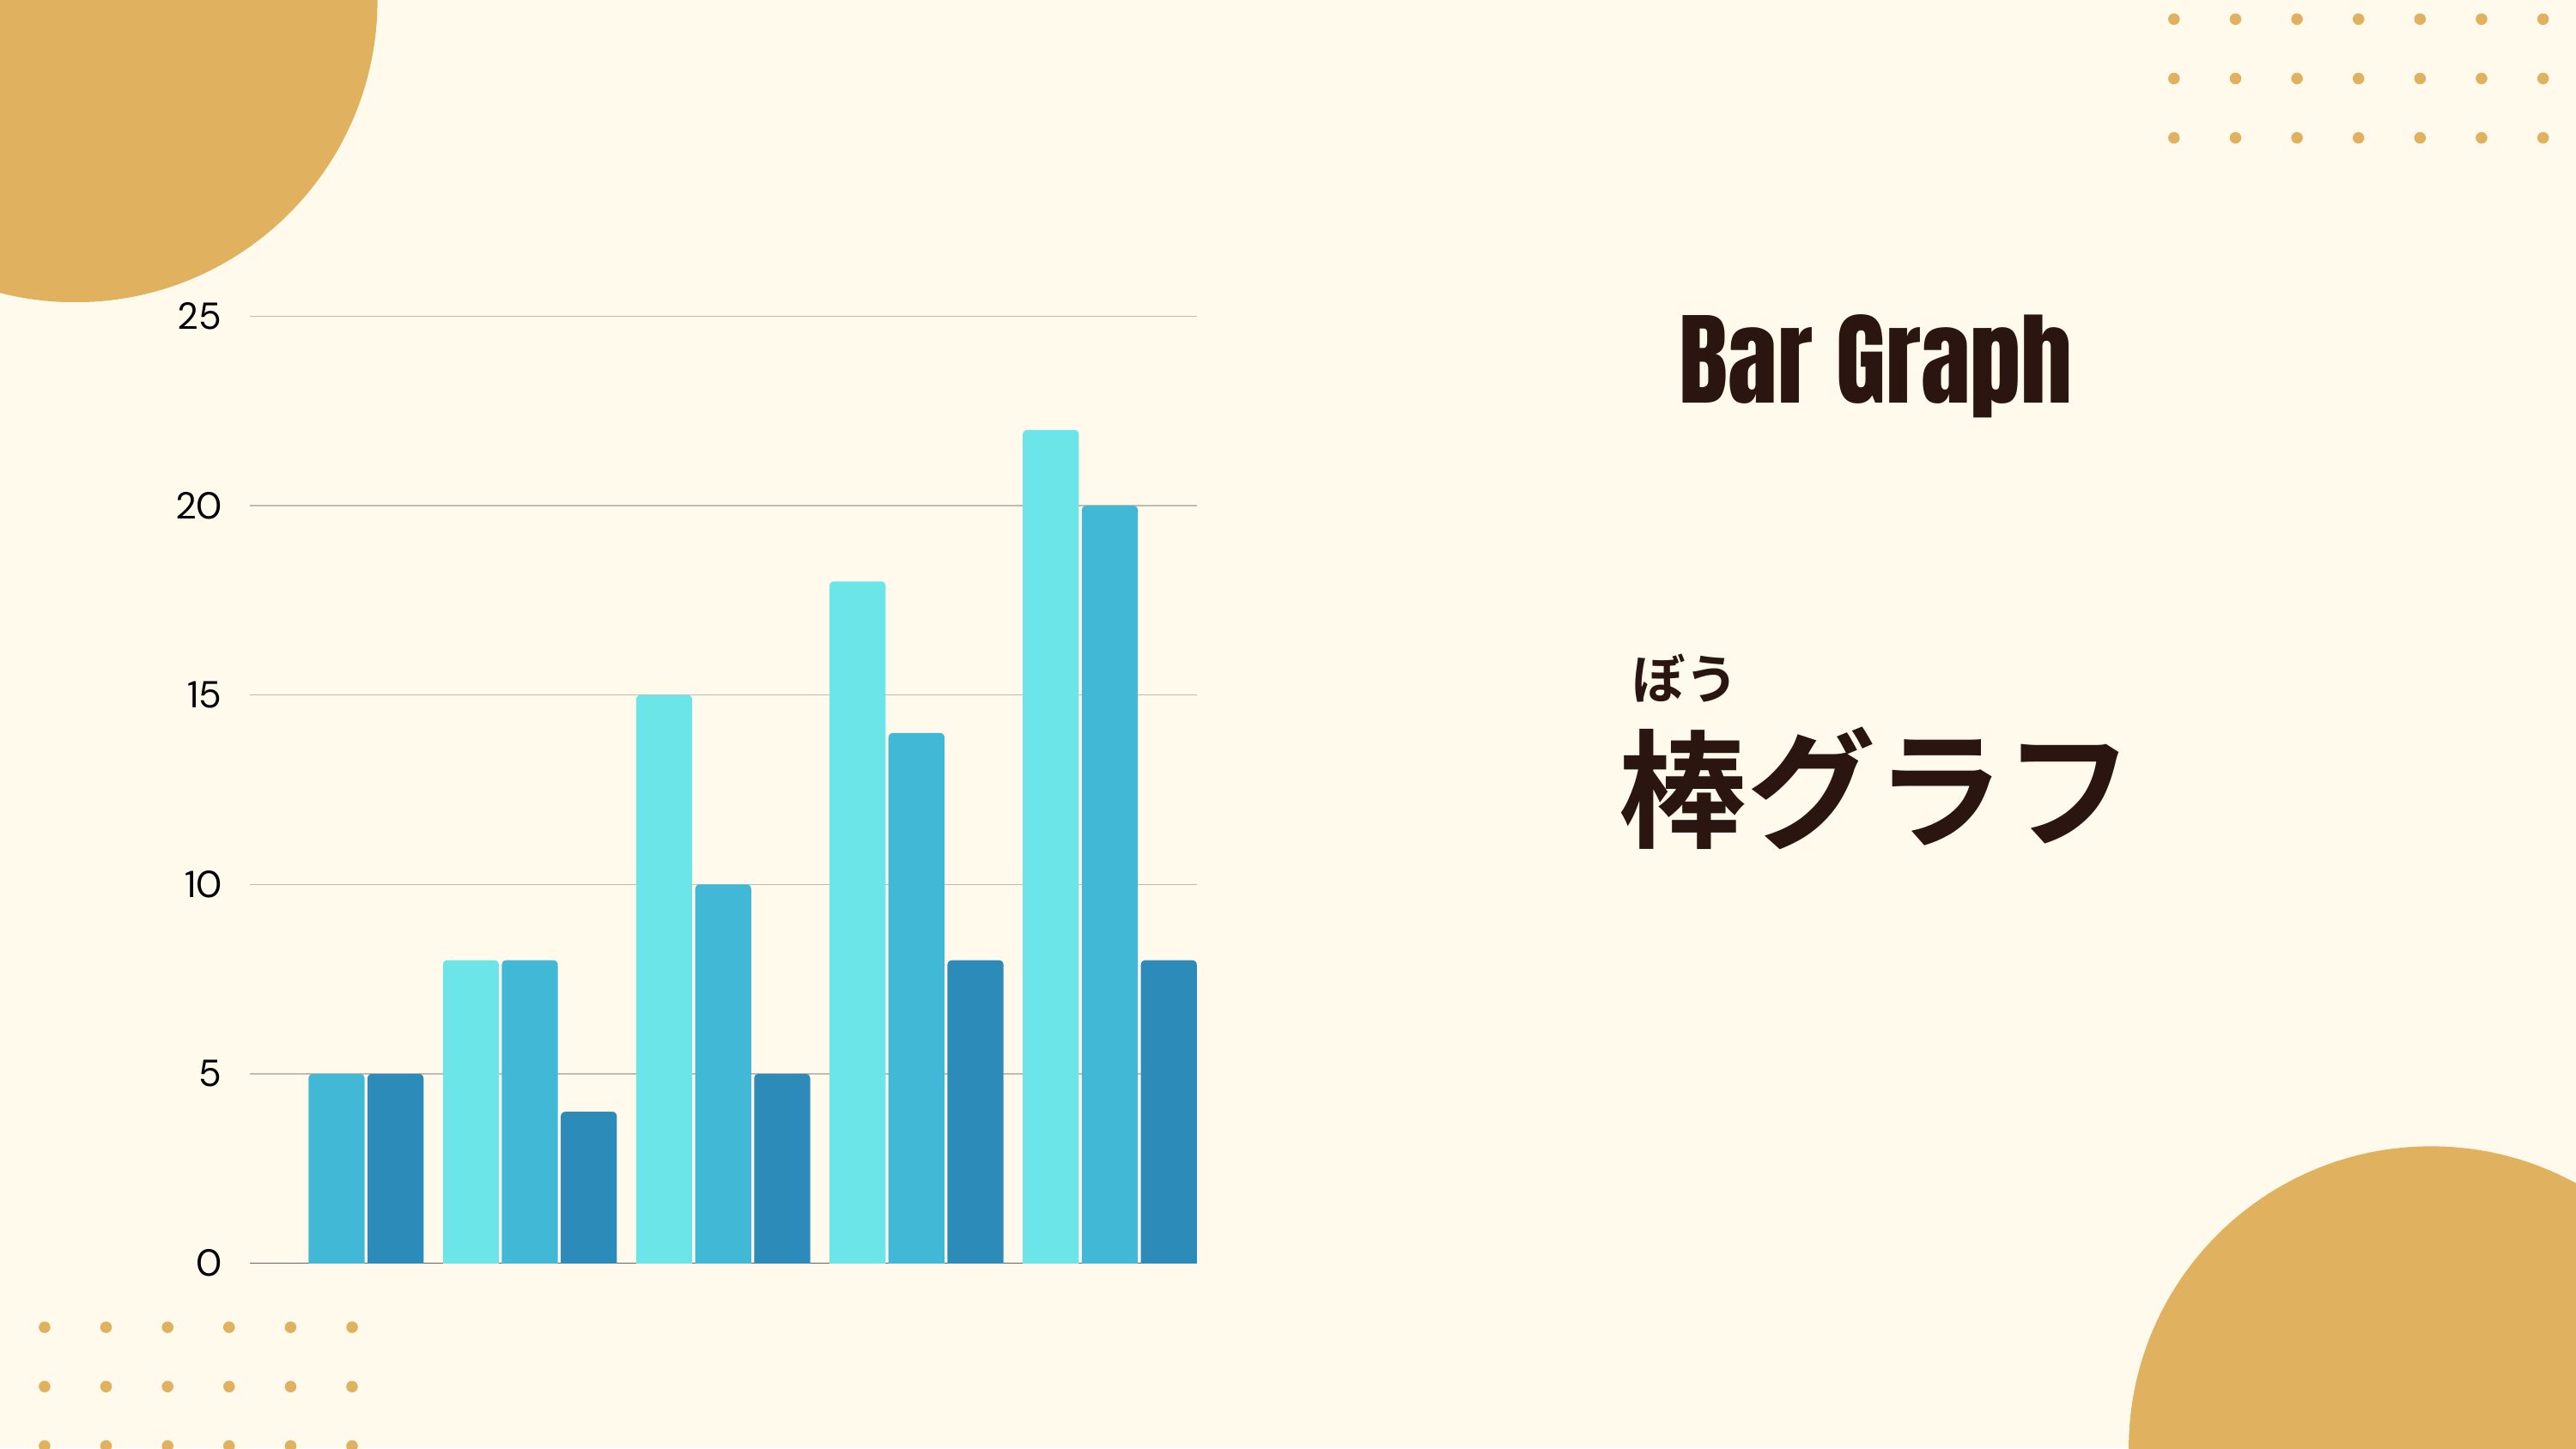
EN Bar Graph
25
20
25
20
JP15ぼう
10
棒グラフ
5
0
10
棒グラフ
5
0
หน้า 6
คลิกเพื่อขยาย
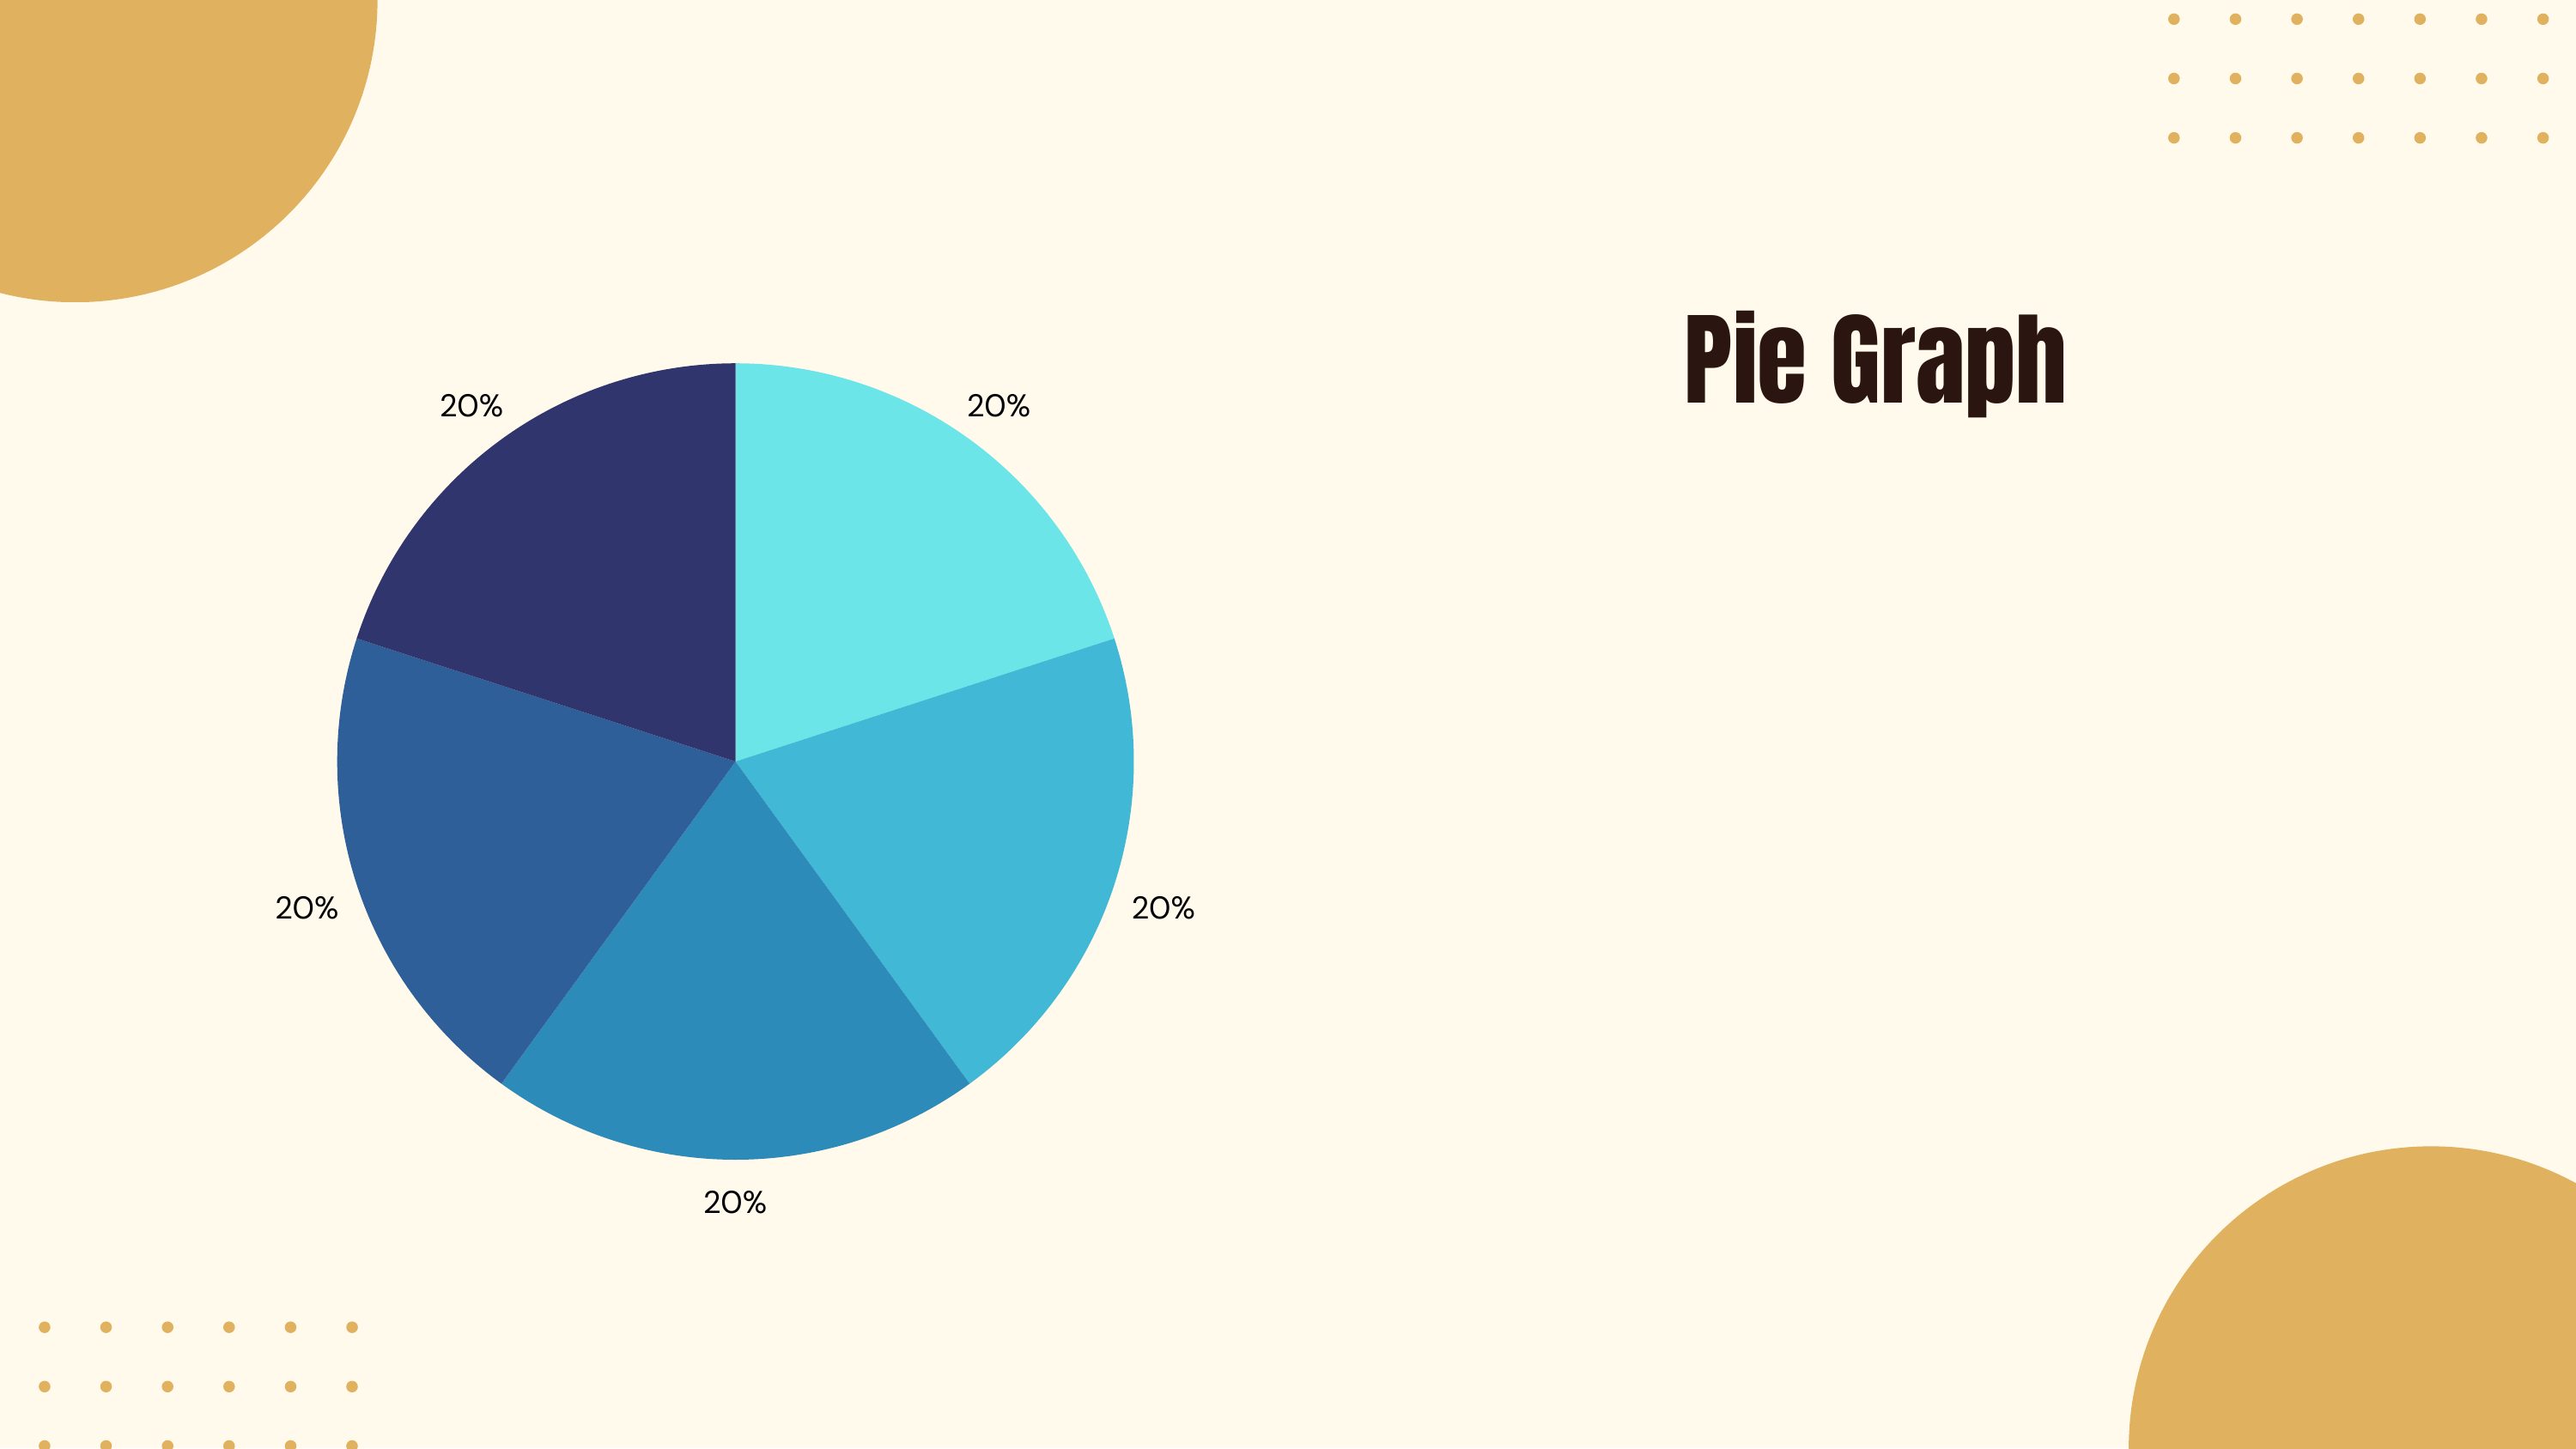
EN 20% 20% Pie Graph
20% 20%
20%
20% 20%
20%
หน้า 7
คลิกเพื่อขยาย
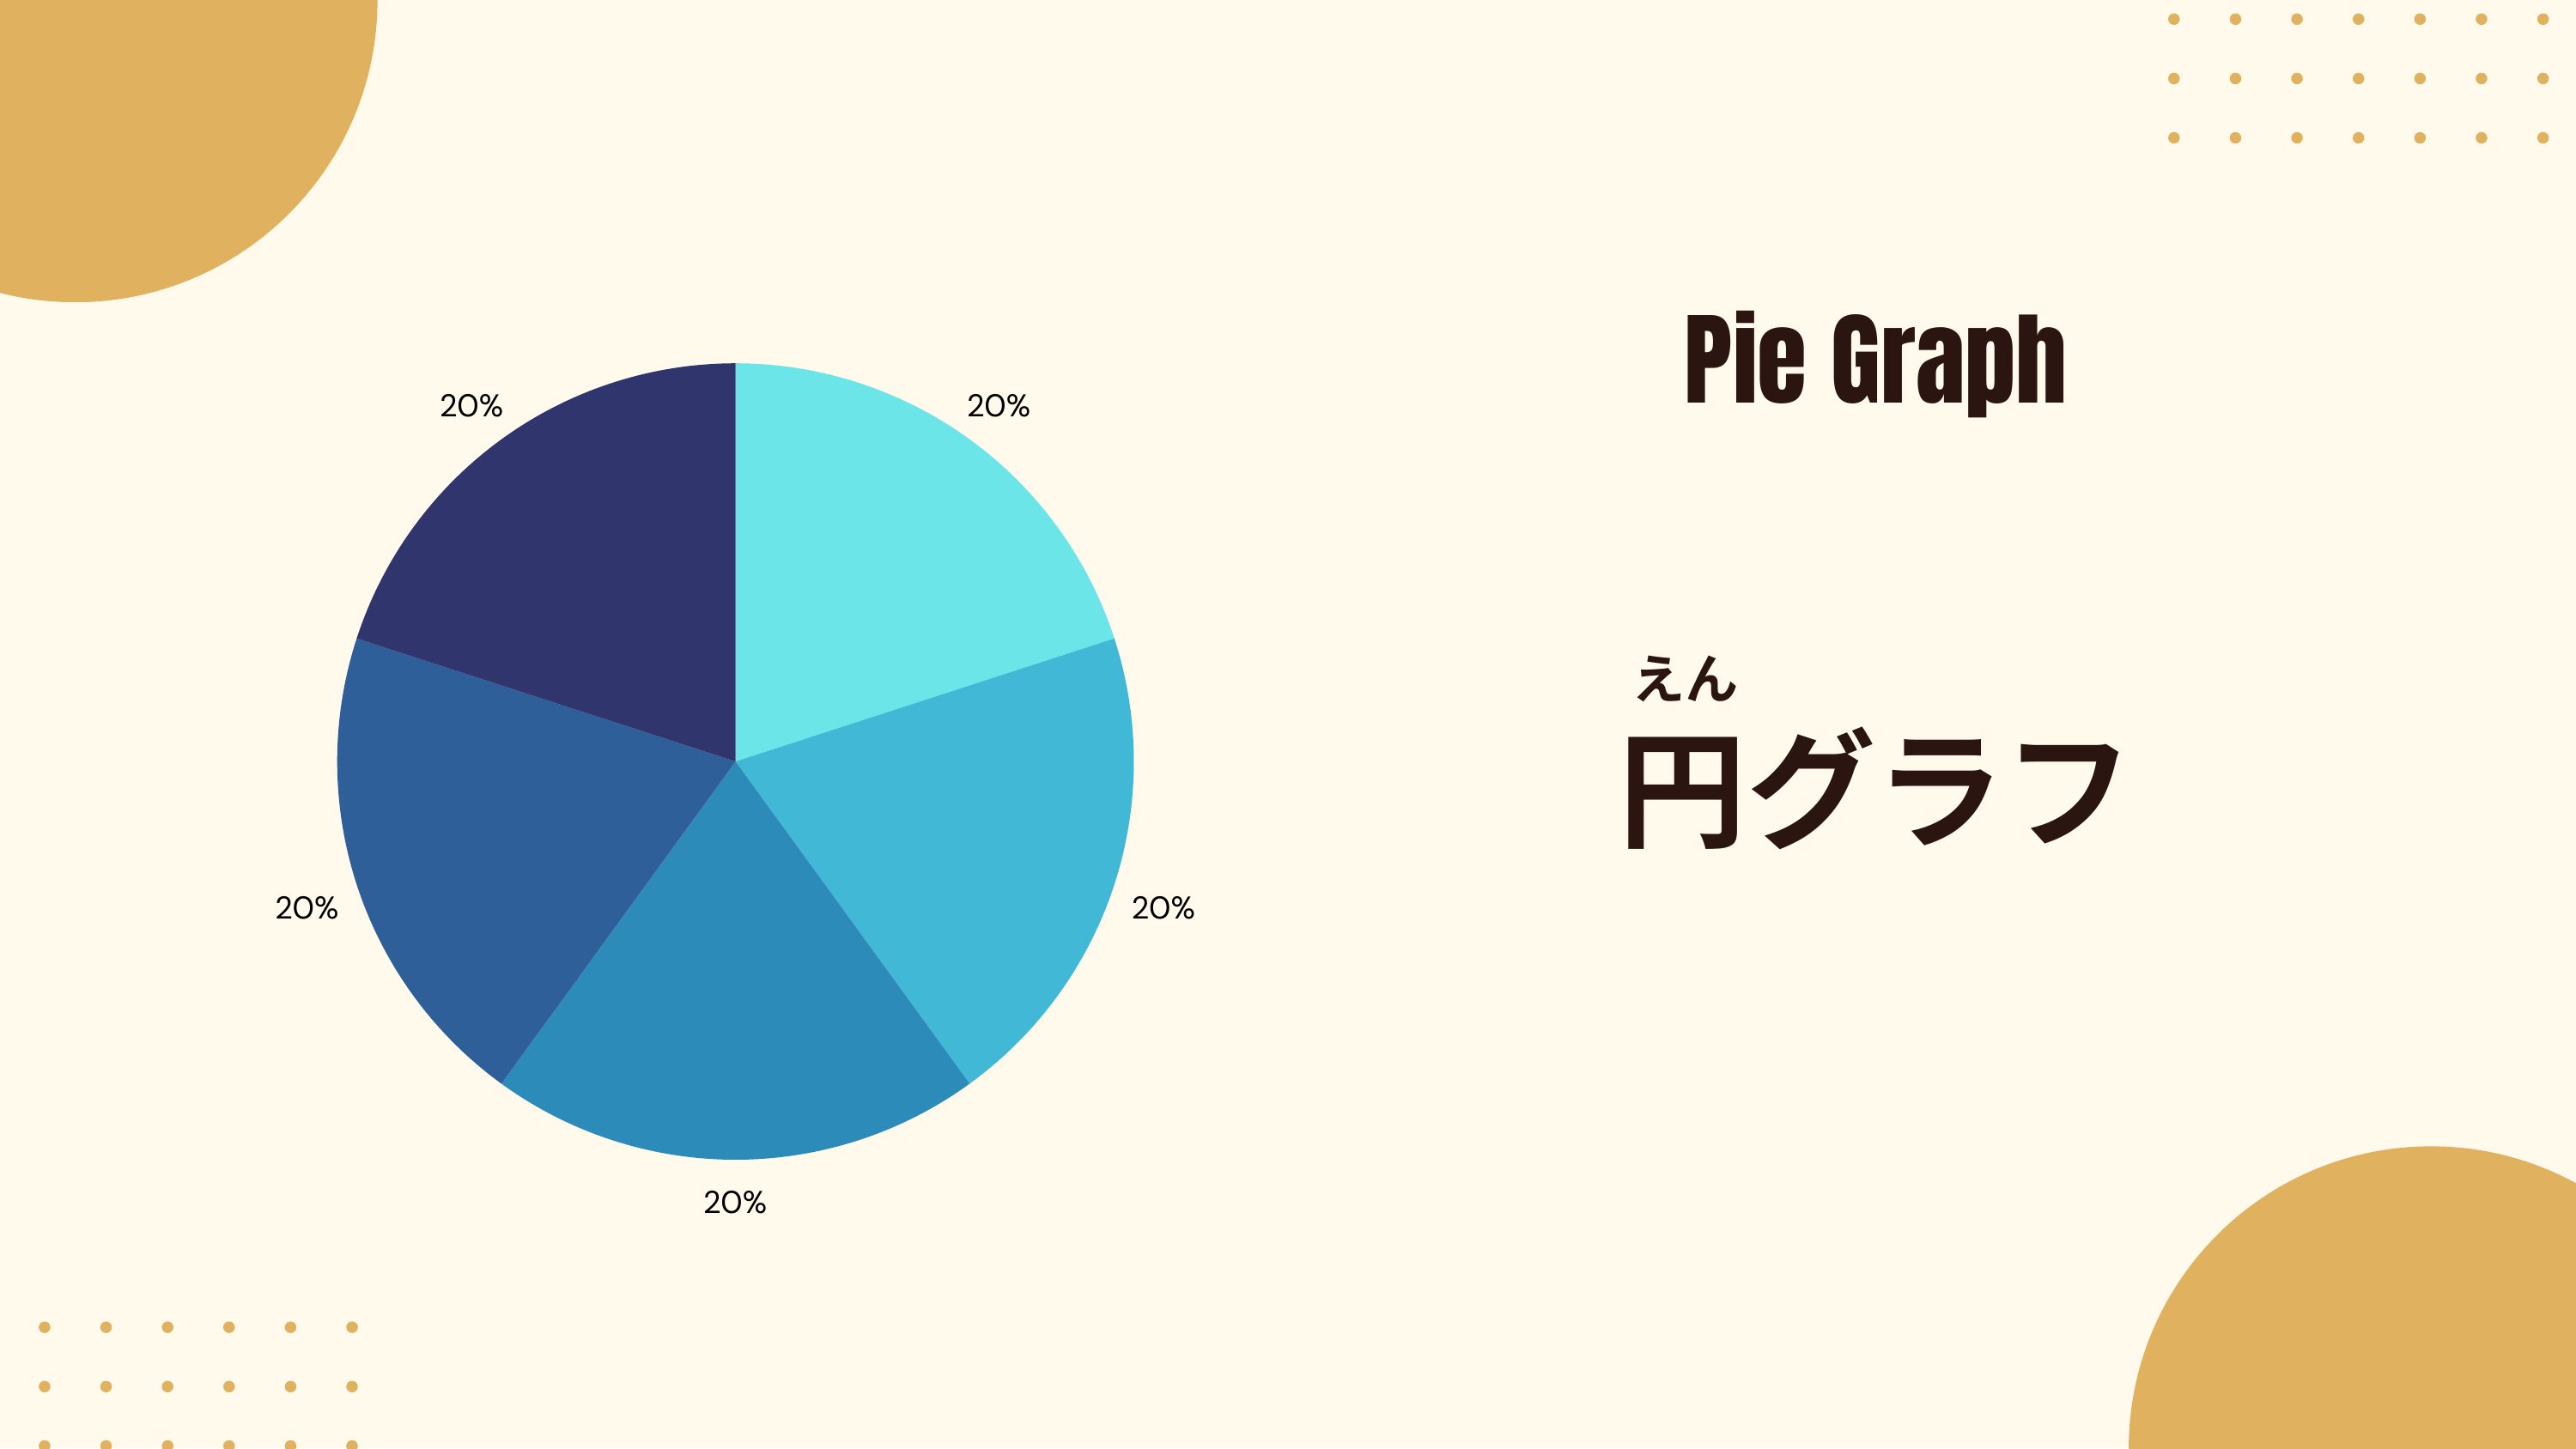
EN 20% 20% Pie Graph
JPえん
円グラフ
20%20%
20%
円グラフ
20%20%
20%
หน้า 8
คลิกเพื่อขยาย
50
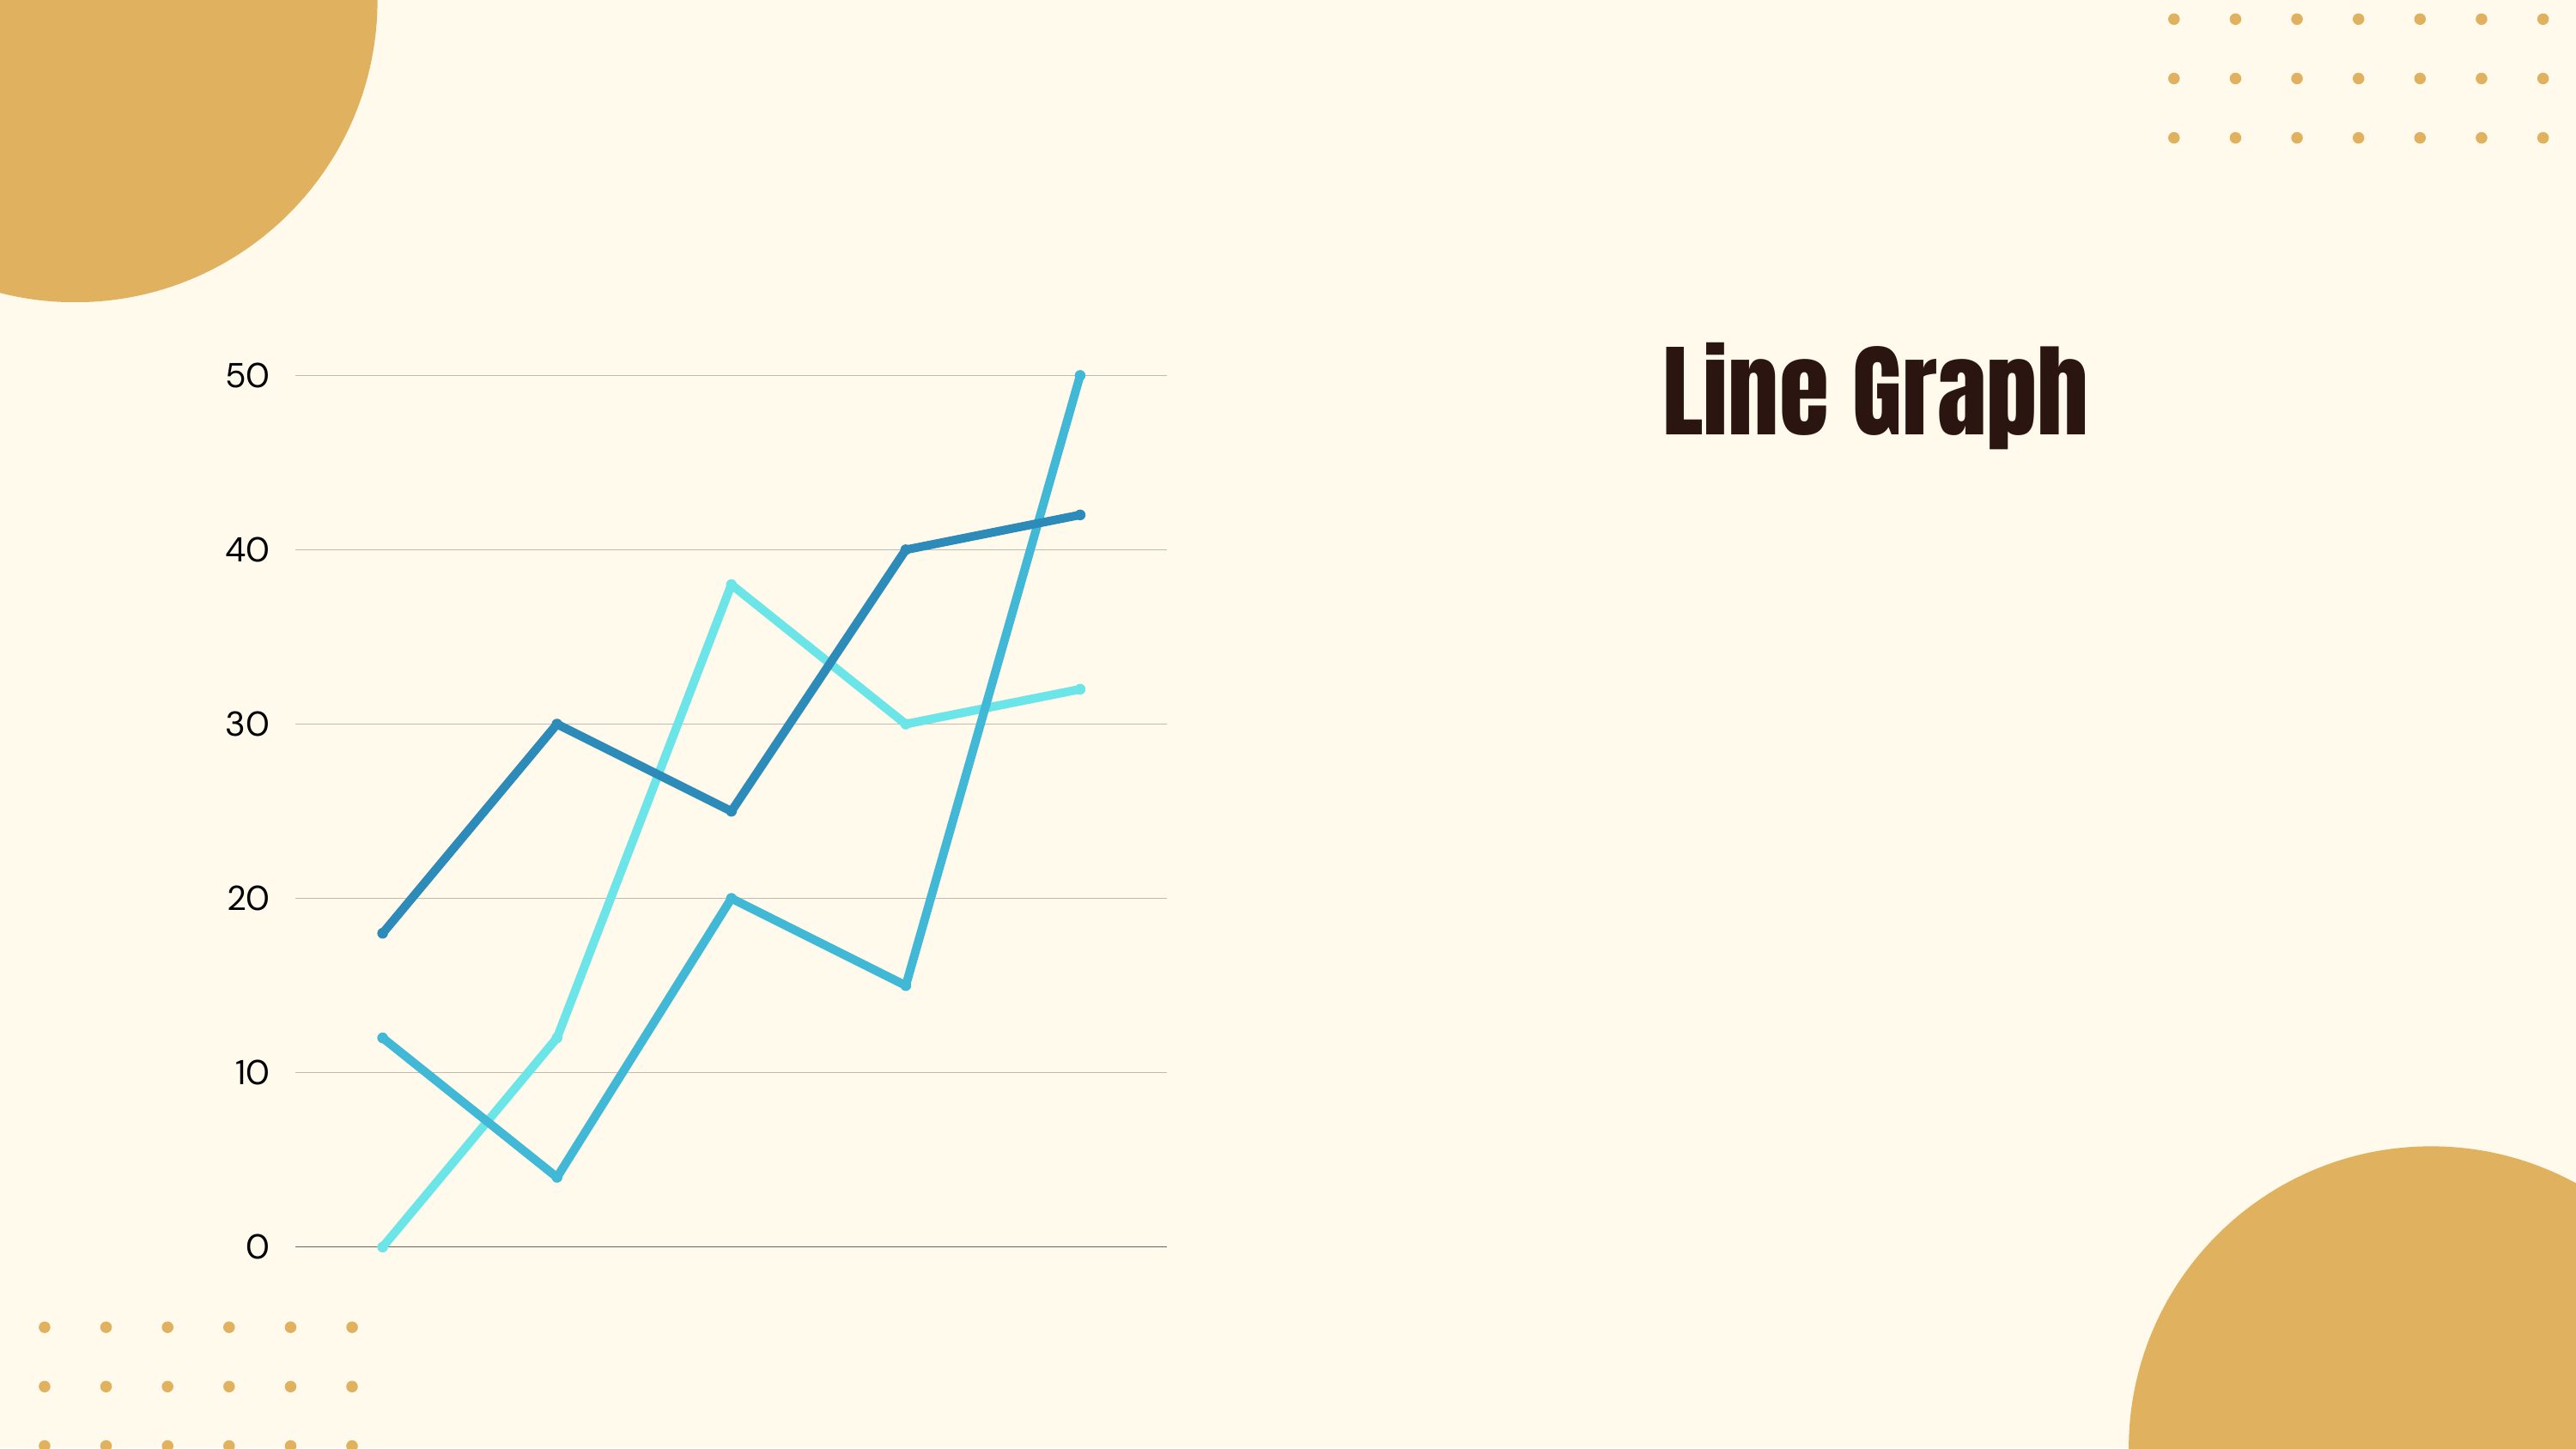
EN Line Graph
40
30
20
10
0
40
30
20
10
0
หน้า 9
คลิกเพื่อขยาย
50
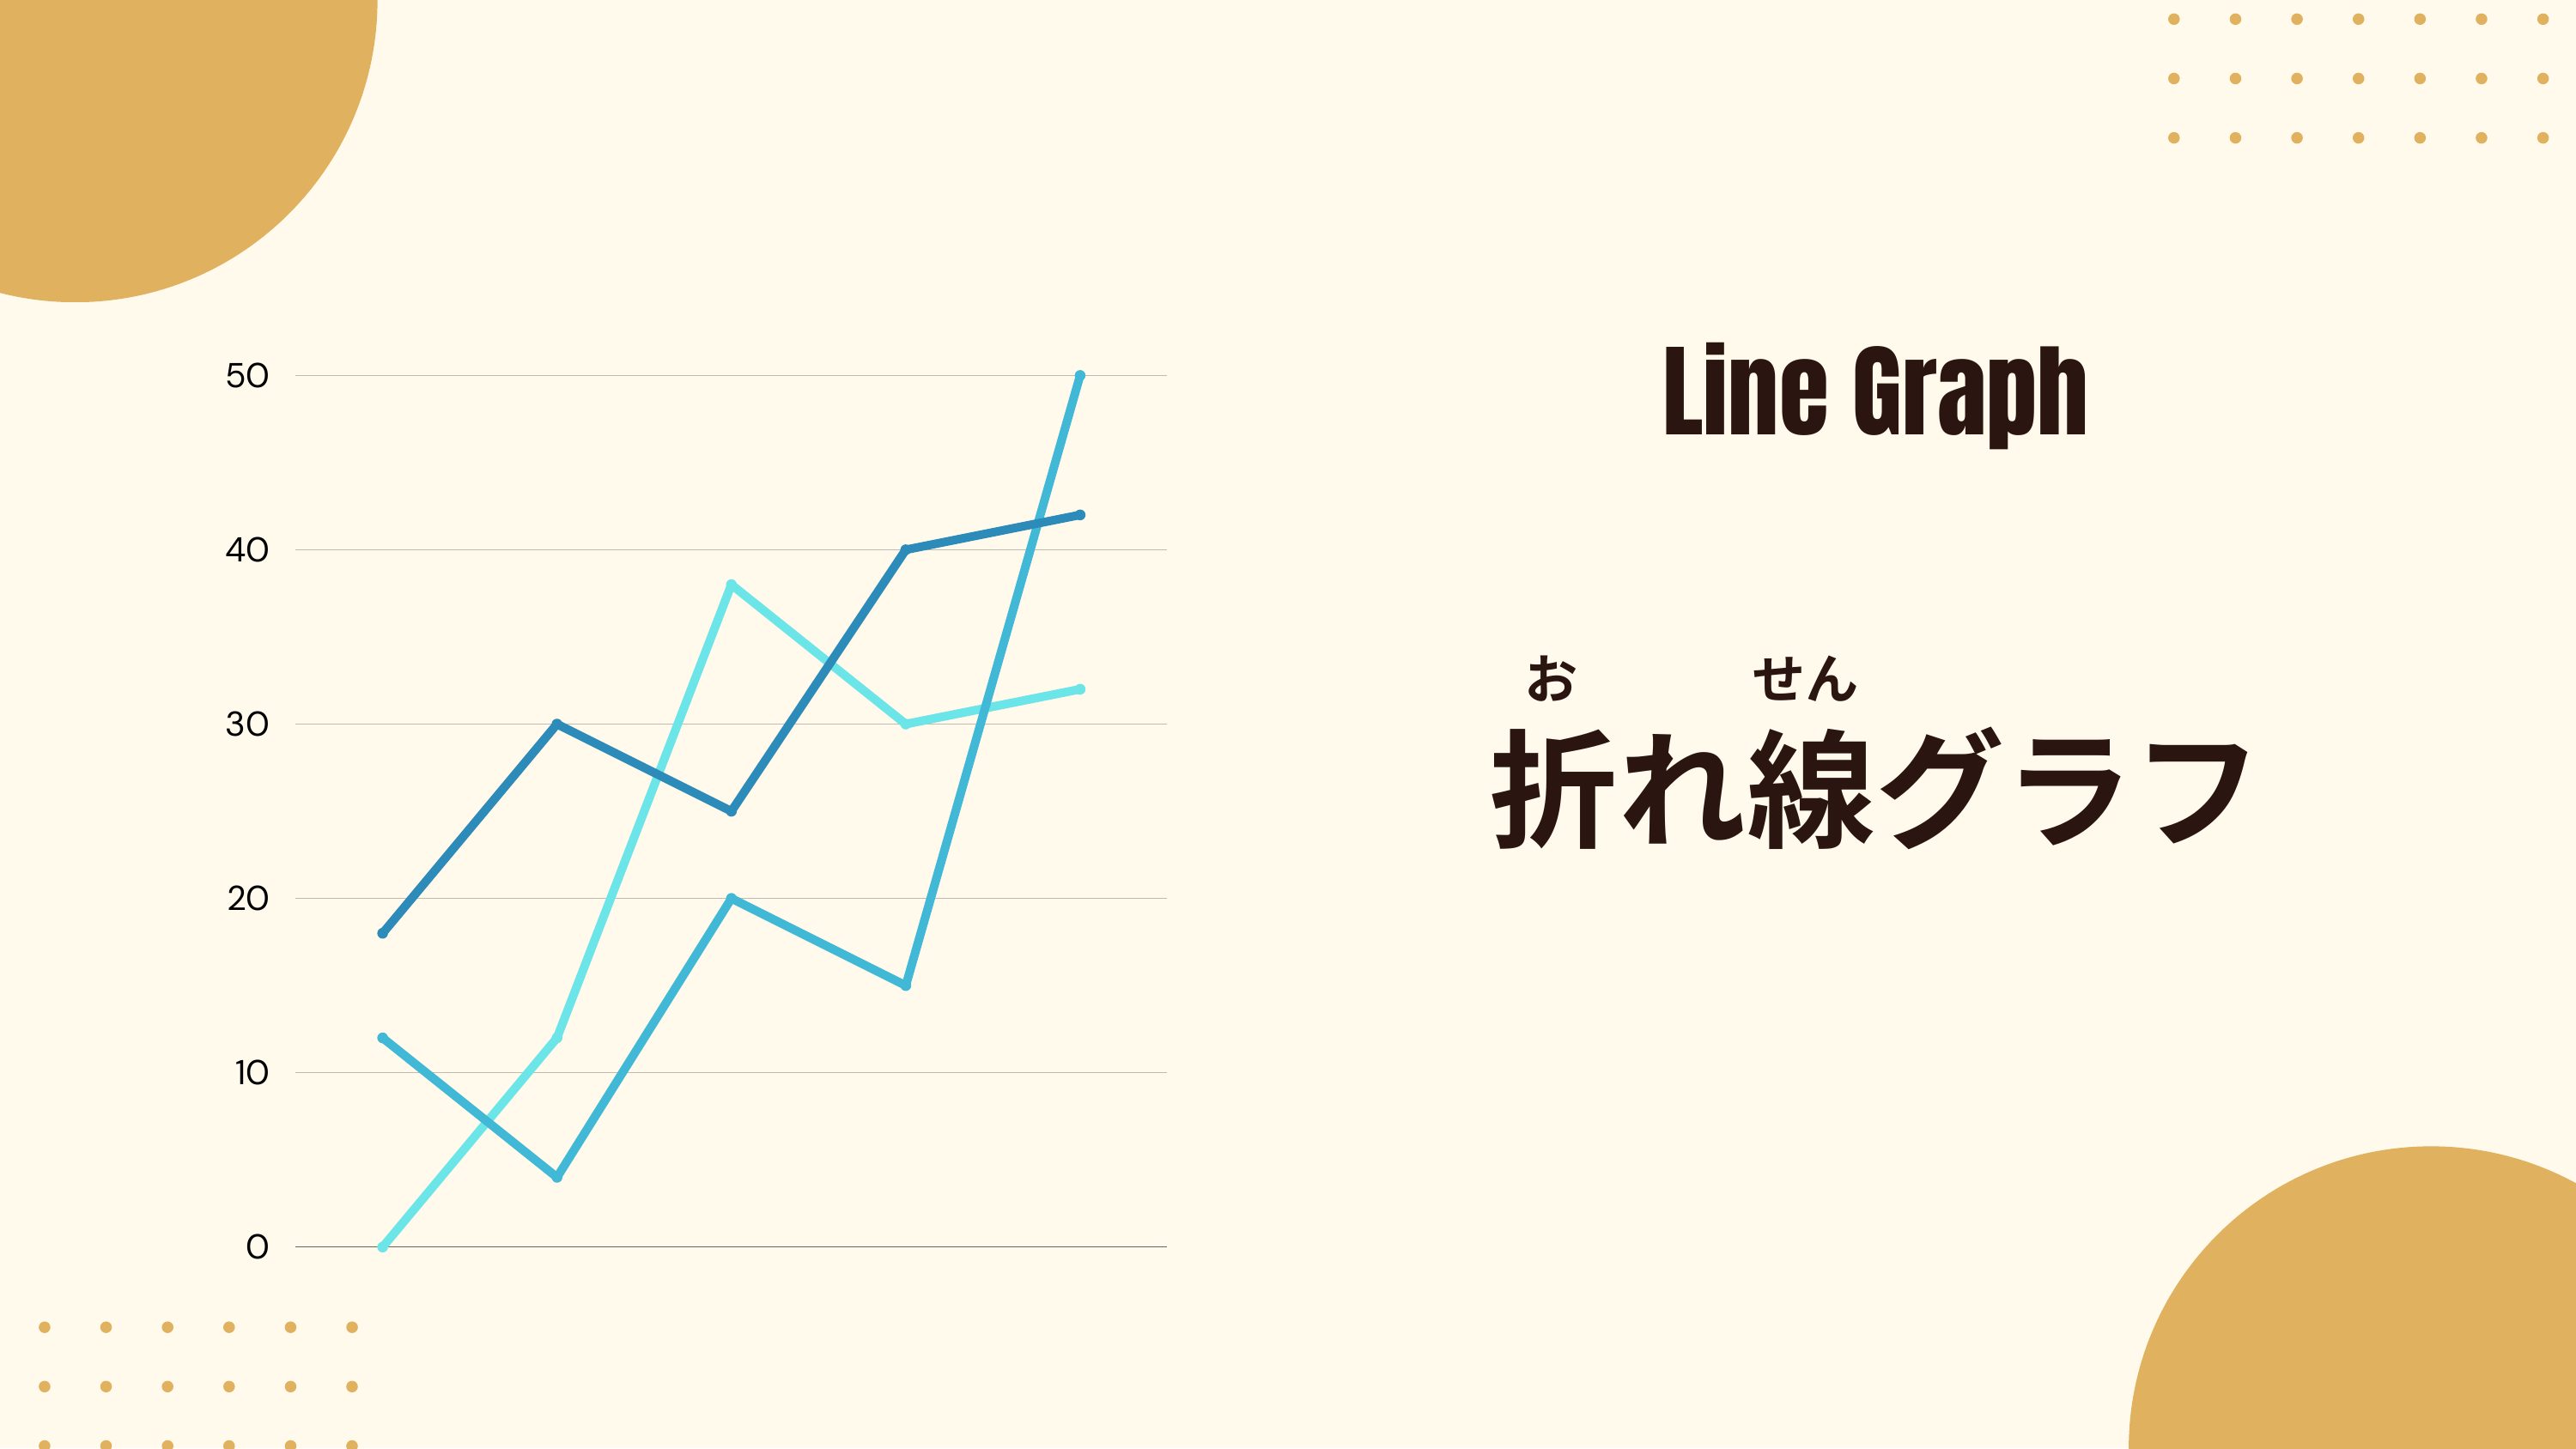
EN Line Graph
40
40
JPおせん
折れ線グラフ
30
20
10
0
折れ線グラフ
30
20
10
0
หน้า 10

คลิกเพื่อขยาย
EN Belt Graph
0 10 20 30 40 50 60
0 10 20 30 40 50 60
หน้า 11
คลิกเพื่อขยาย
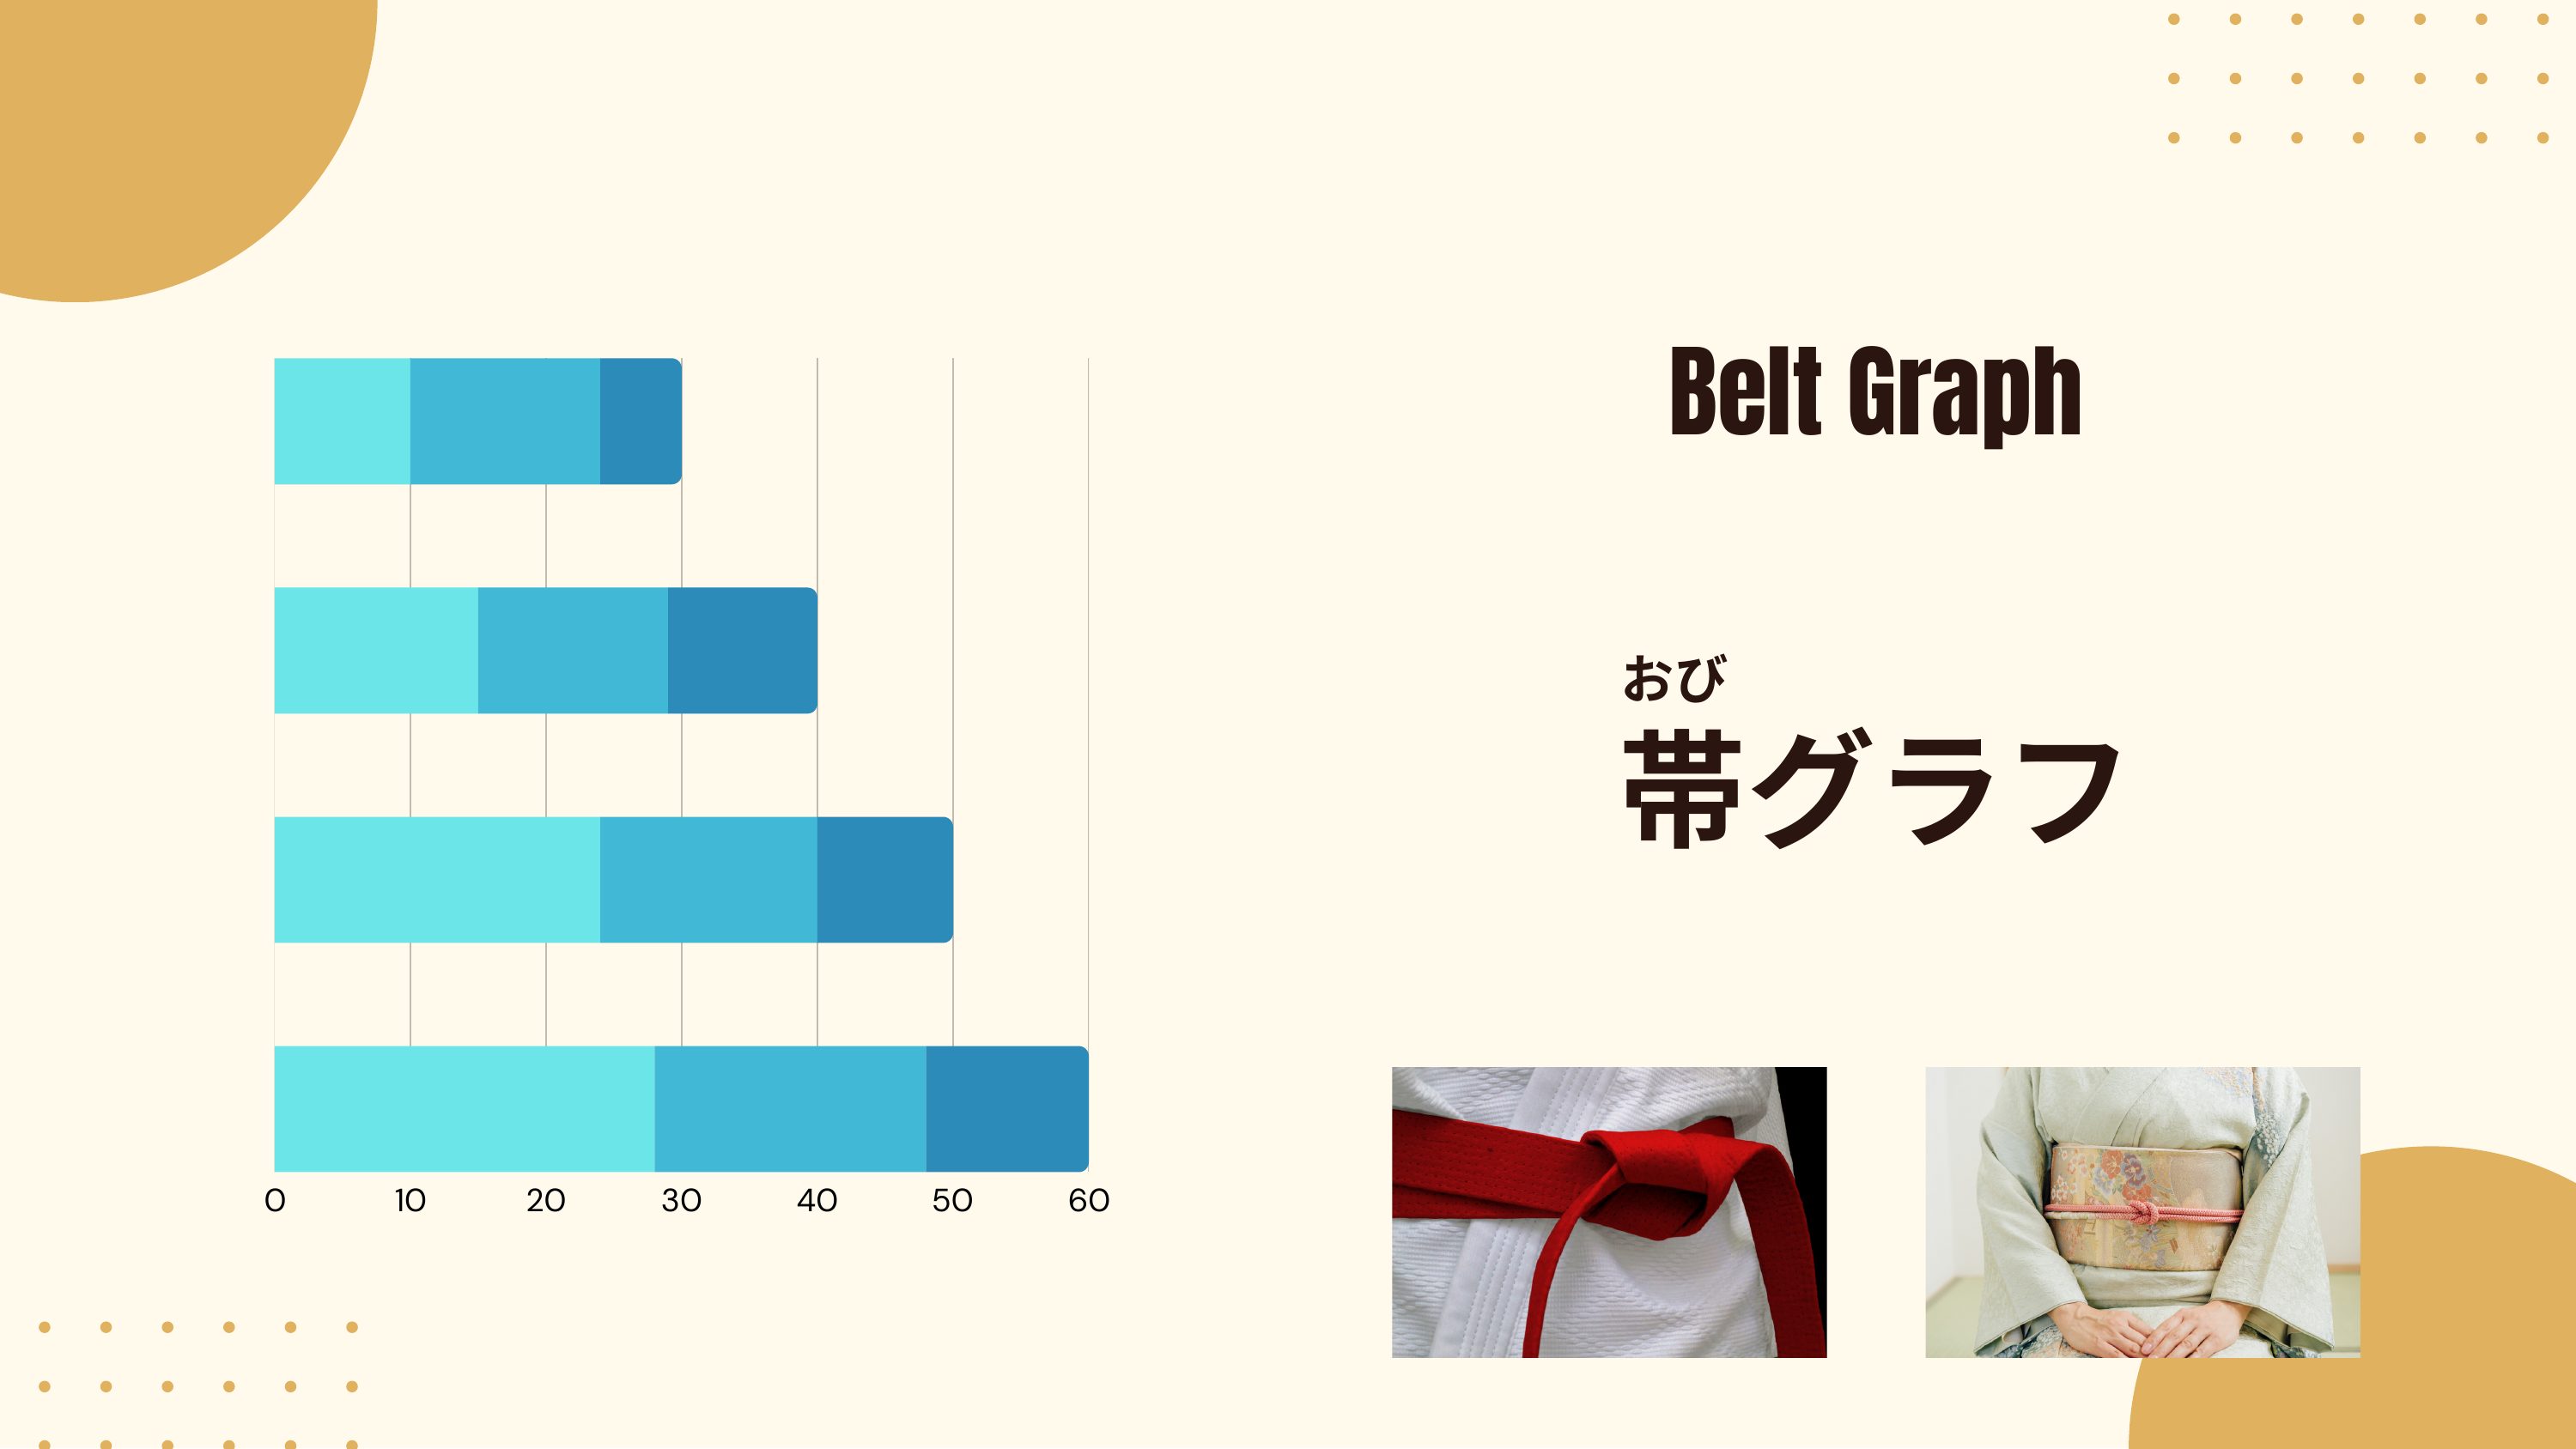
EN Belt Graph
JPおび
帯グラフ
0102030405060
帯グラフ
0102030405060
หน้า 12

คลิกเพื่อขยาย
2
JPグラフの変動を表現しよう
へんどうひょうげん
へんどうひょうげん
EN Let's express changes in graphs
หน้า 13

คลิกเพื่อขยาย
หน้า 14
คลิกเพื่อขยาย
JPふ
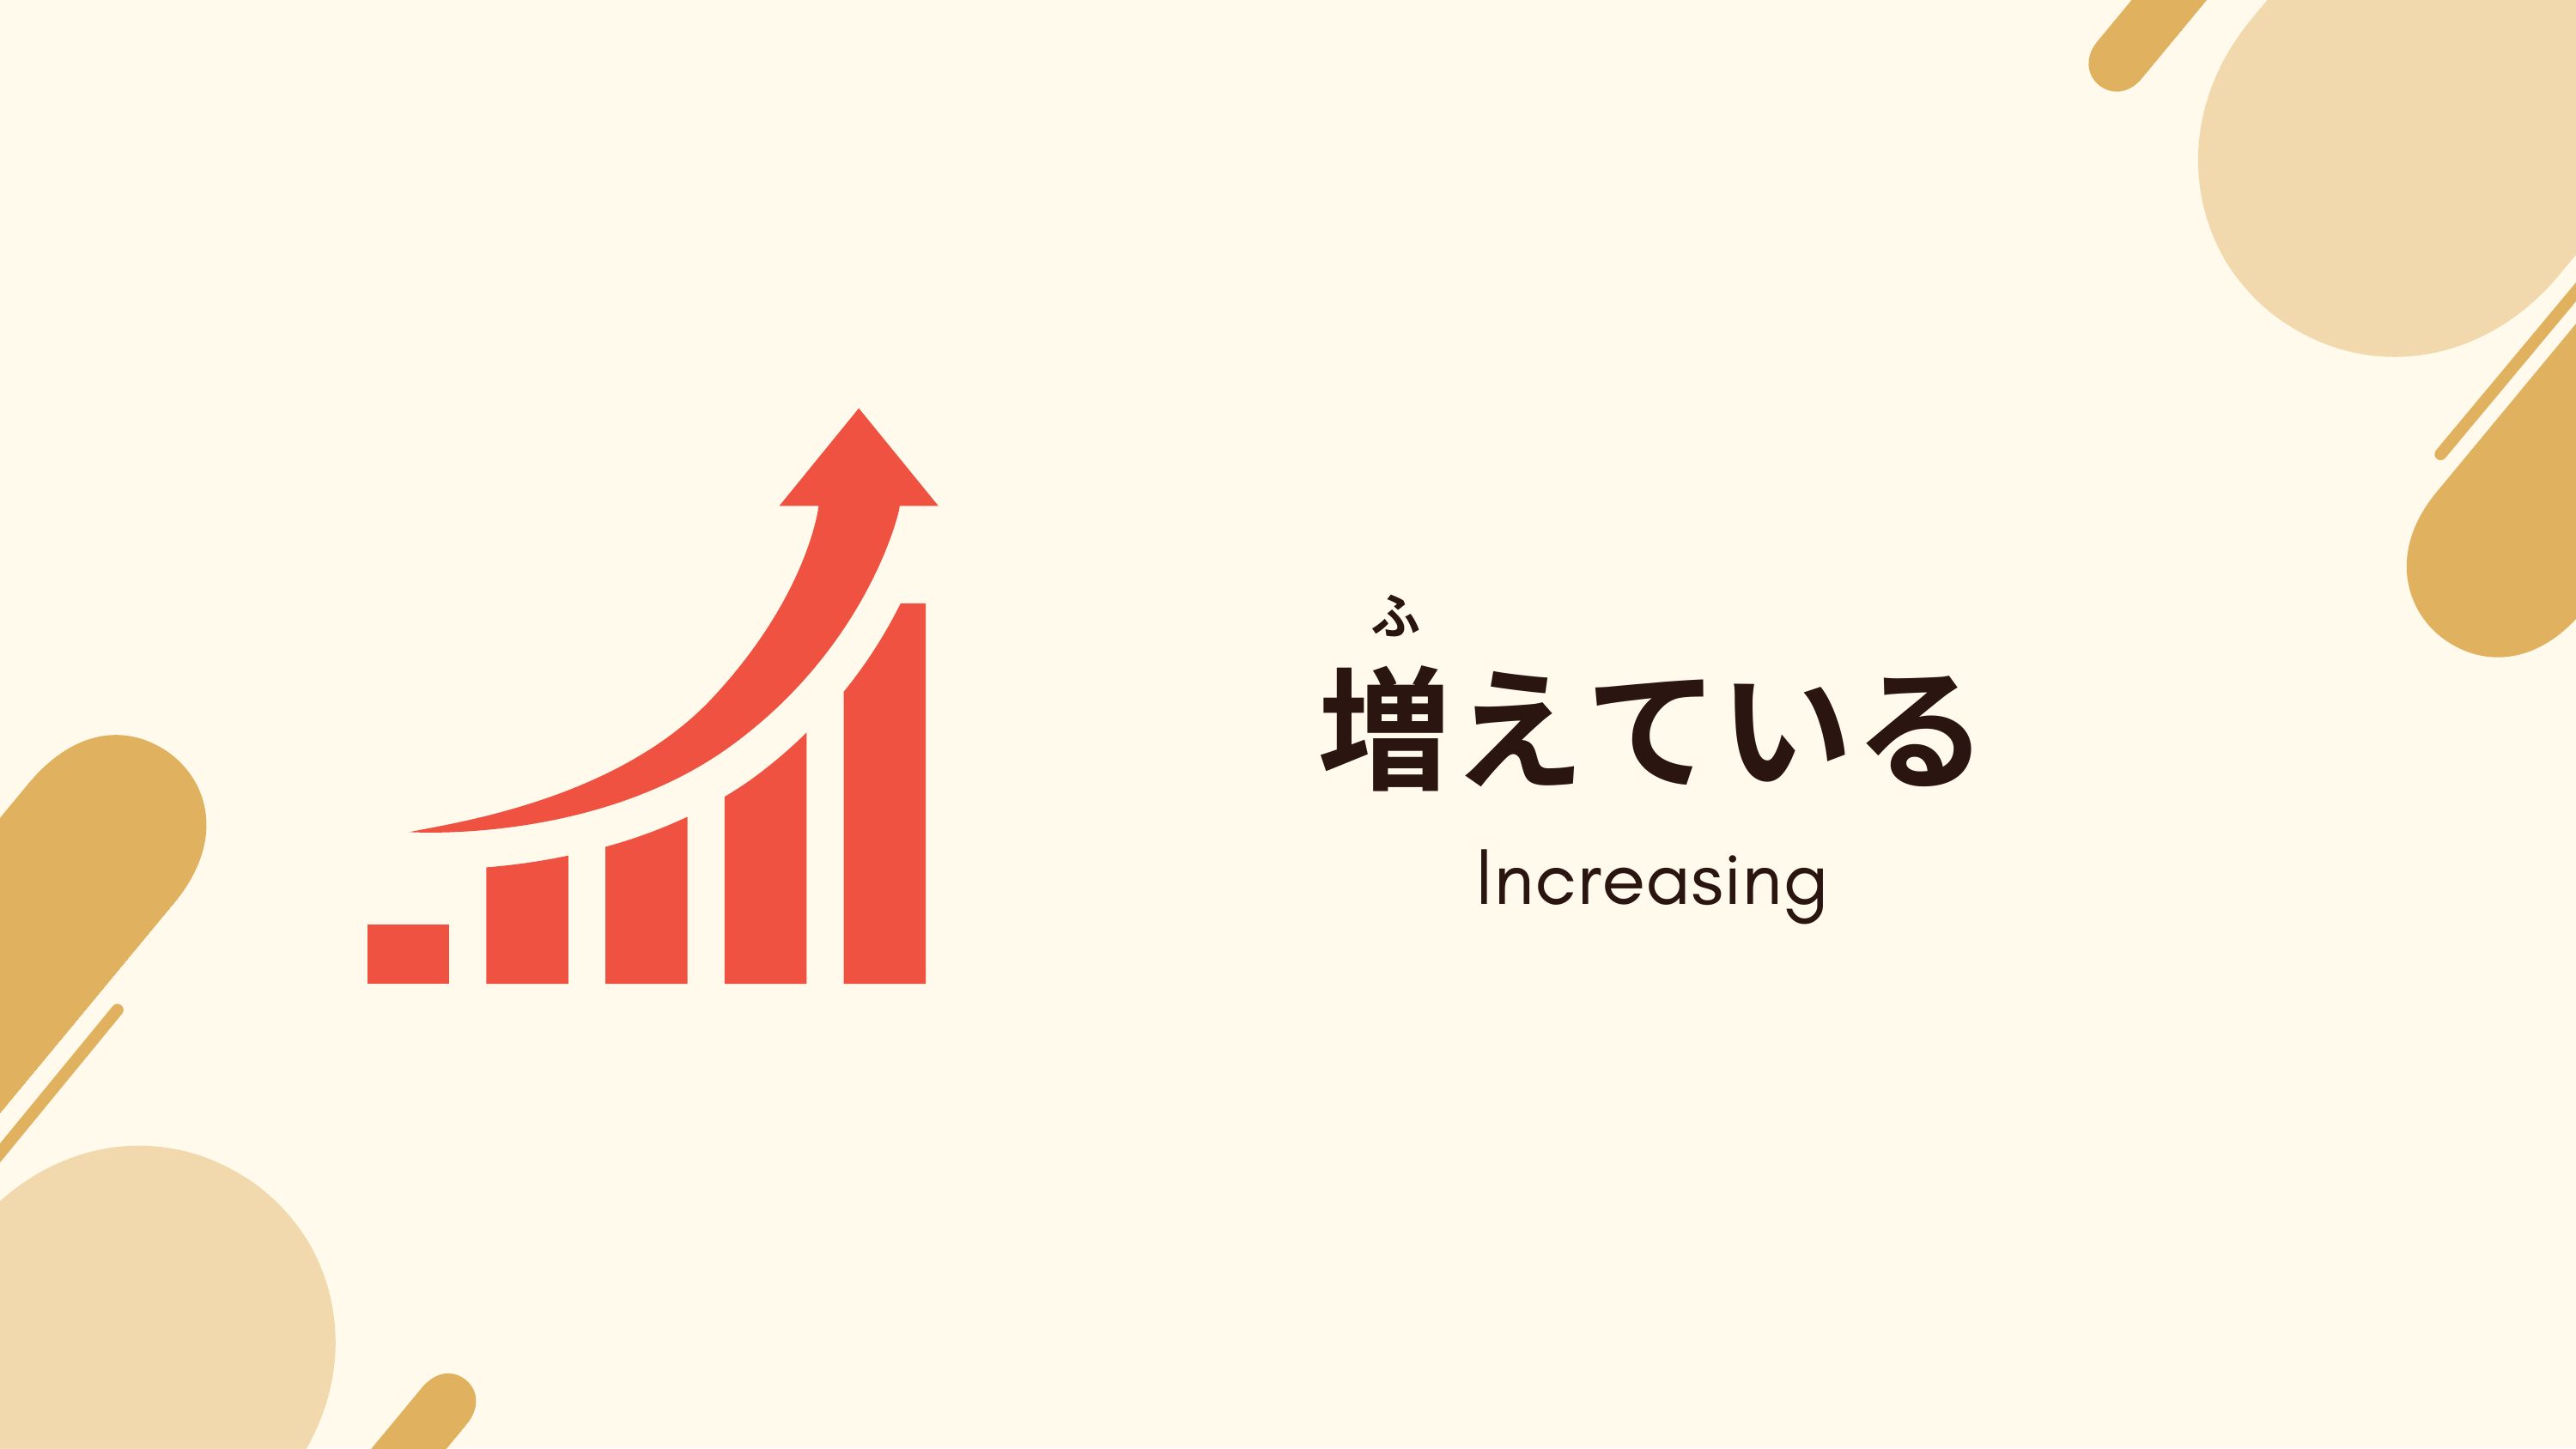
増えている
増えている
EN Increasing
หน้า 15
คลิกเพื่อขยาย
JPふ
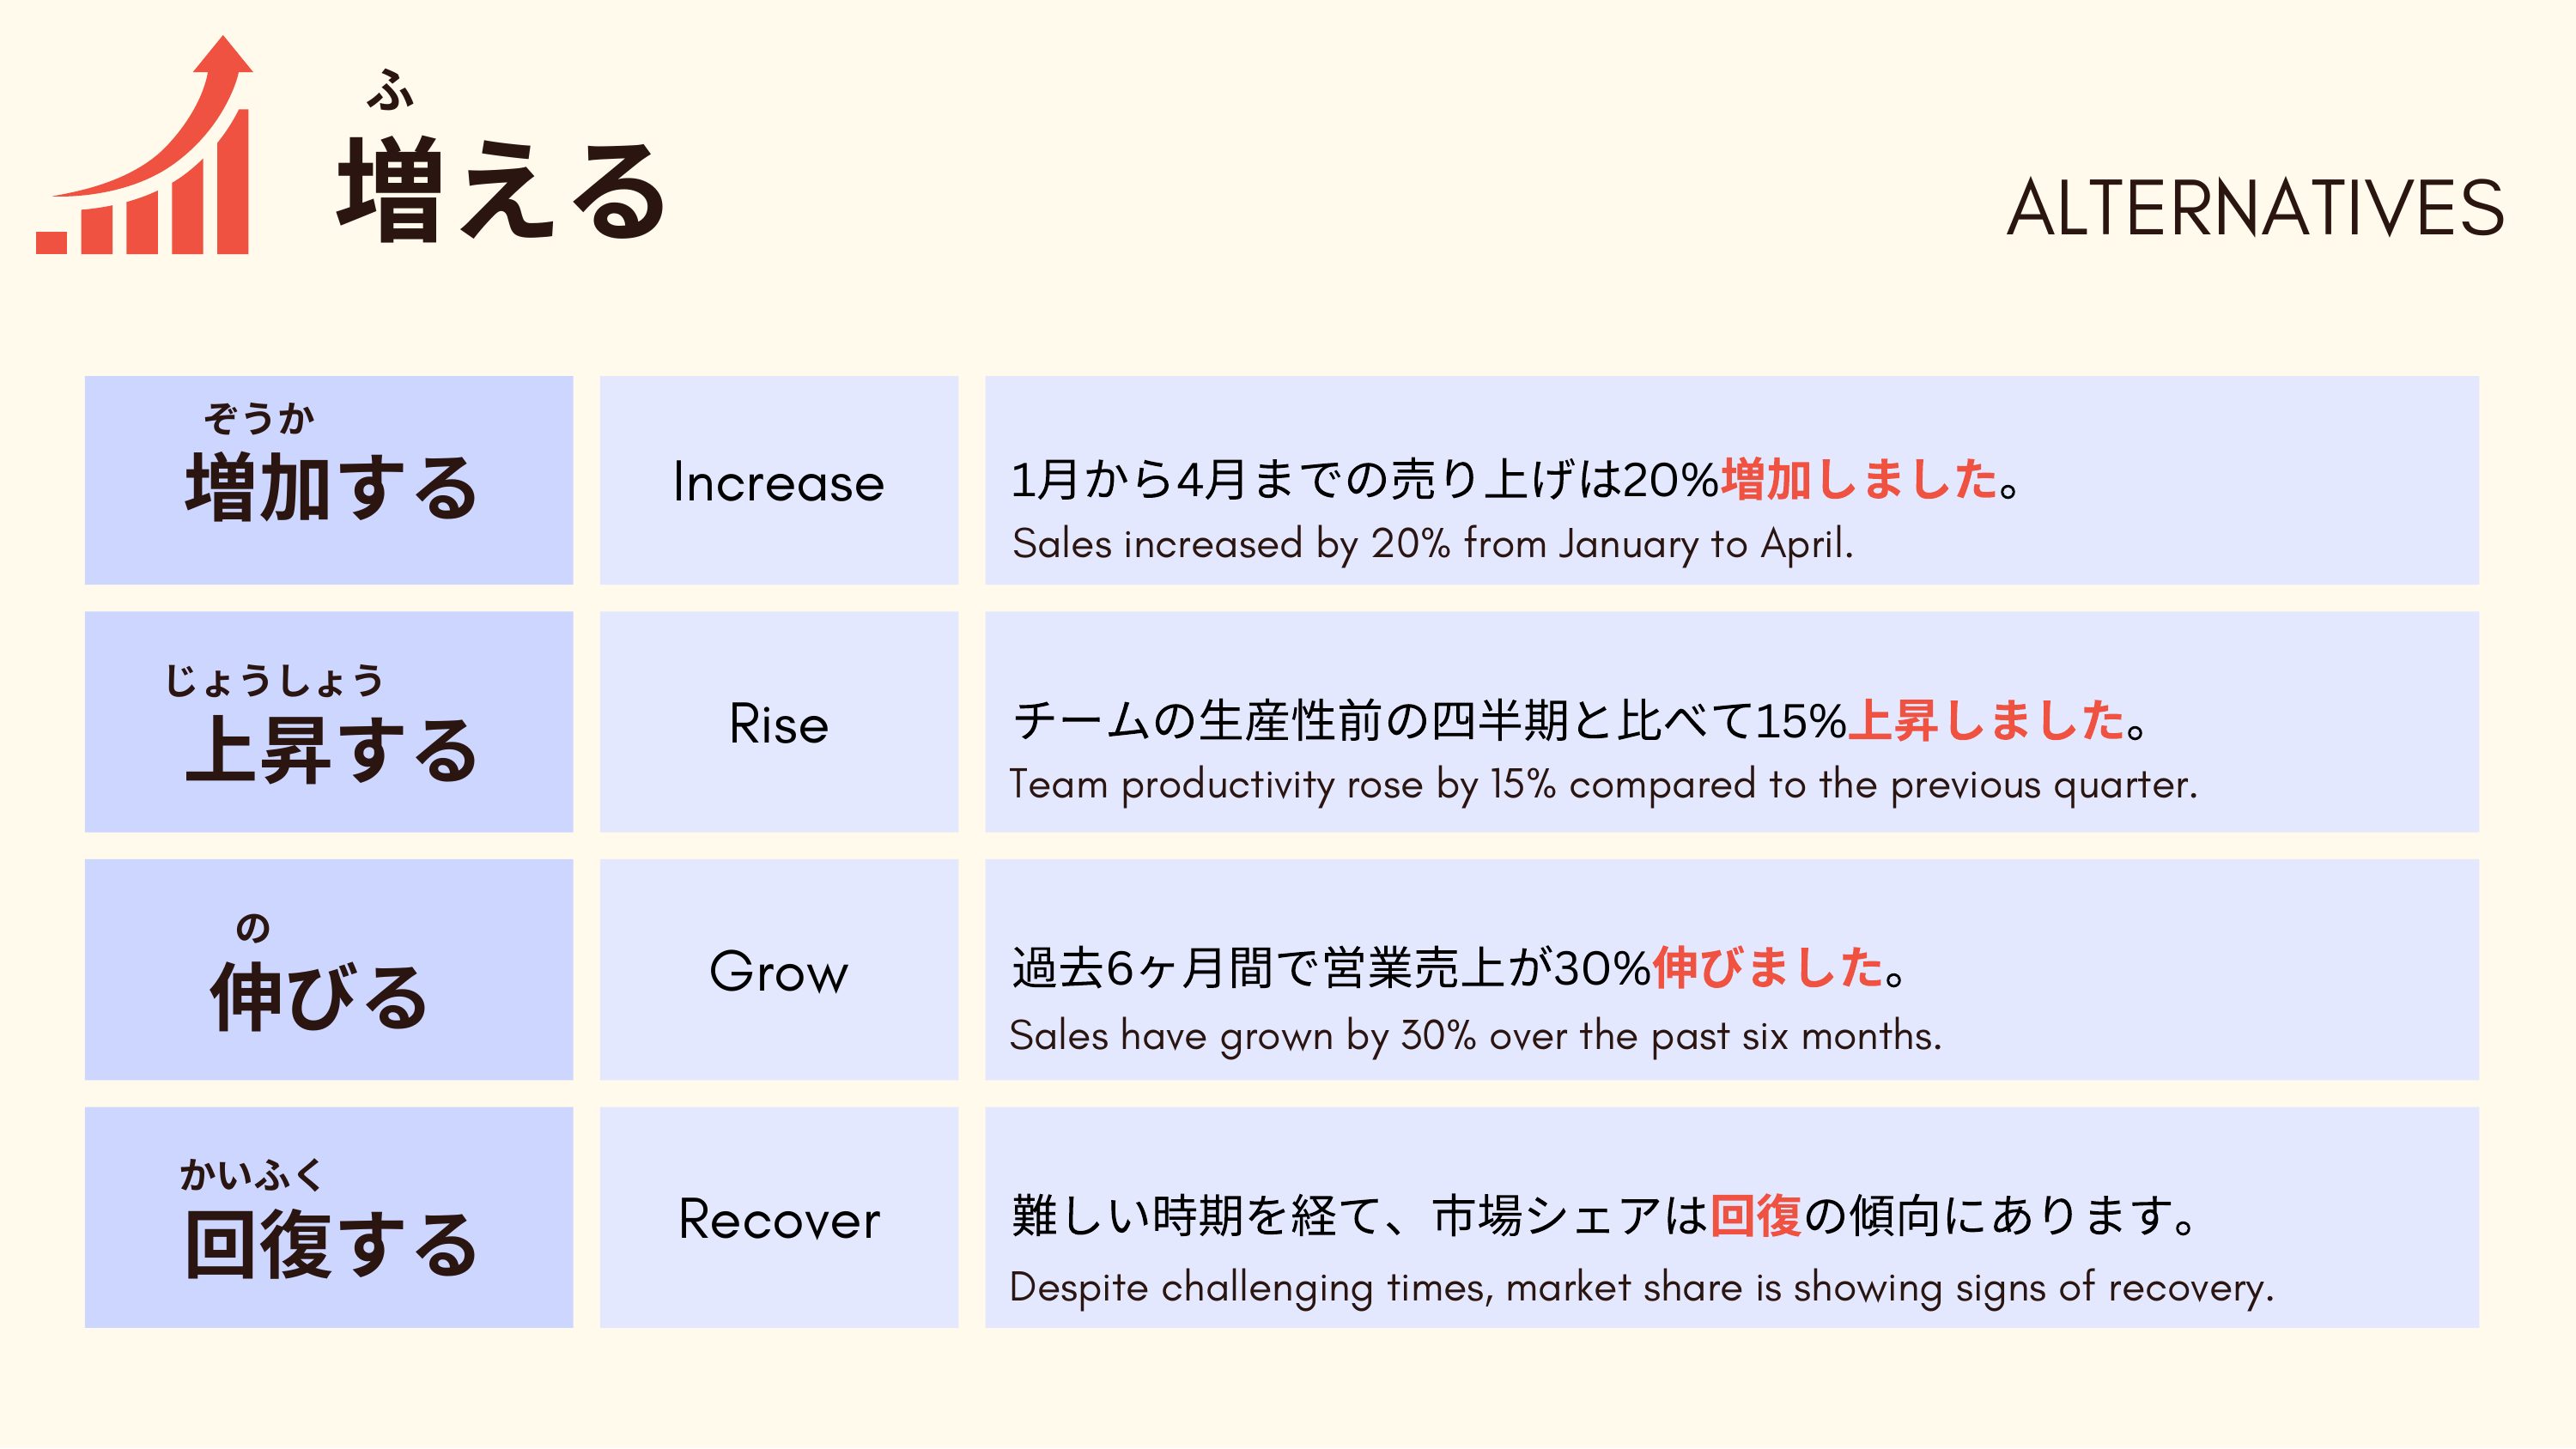
EN 増える ALTERNATIVES
JPぞうか
増加するIncrease1月から4月までの売り上げは20%増加しました。
増加するIncrease1月から4月までの売り上げは20%増加しました。
EN Sales increased by 20% from January to April.
JPじょうしょう
上昇するRiseチームの生産性前の四半期と比べて15%上昇しました。
上昇するRiseチームの生産性前の四半期と比べて15%上昇しました。
EN Team productivity rose by 15% compared to the previous quarter.
JPの
伸びるGrow過去6ヶ月間で営業売上が30%伸びました。
伸びるGrow過去6ヶ月間で営業売上が30%伸びました。
EN Sales have grown by 30% over the past six months.
JPかいふく
回復するRecover難しい時期を経て、市場シェアは回復の傾向にあります。
回復するRecover難しい時期を経て、市場シェアは回復の傾向にあります。
EN Despite challenging times, market share is showing signs of recovery.
หน้า 16

คลิกเพื่อขยาย
หน้า 17
คลิกเพื่อขยาย
JPへ
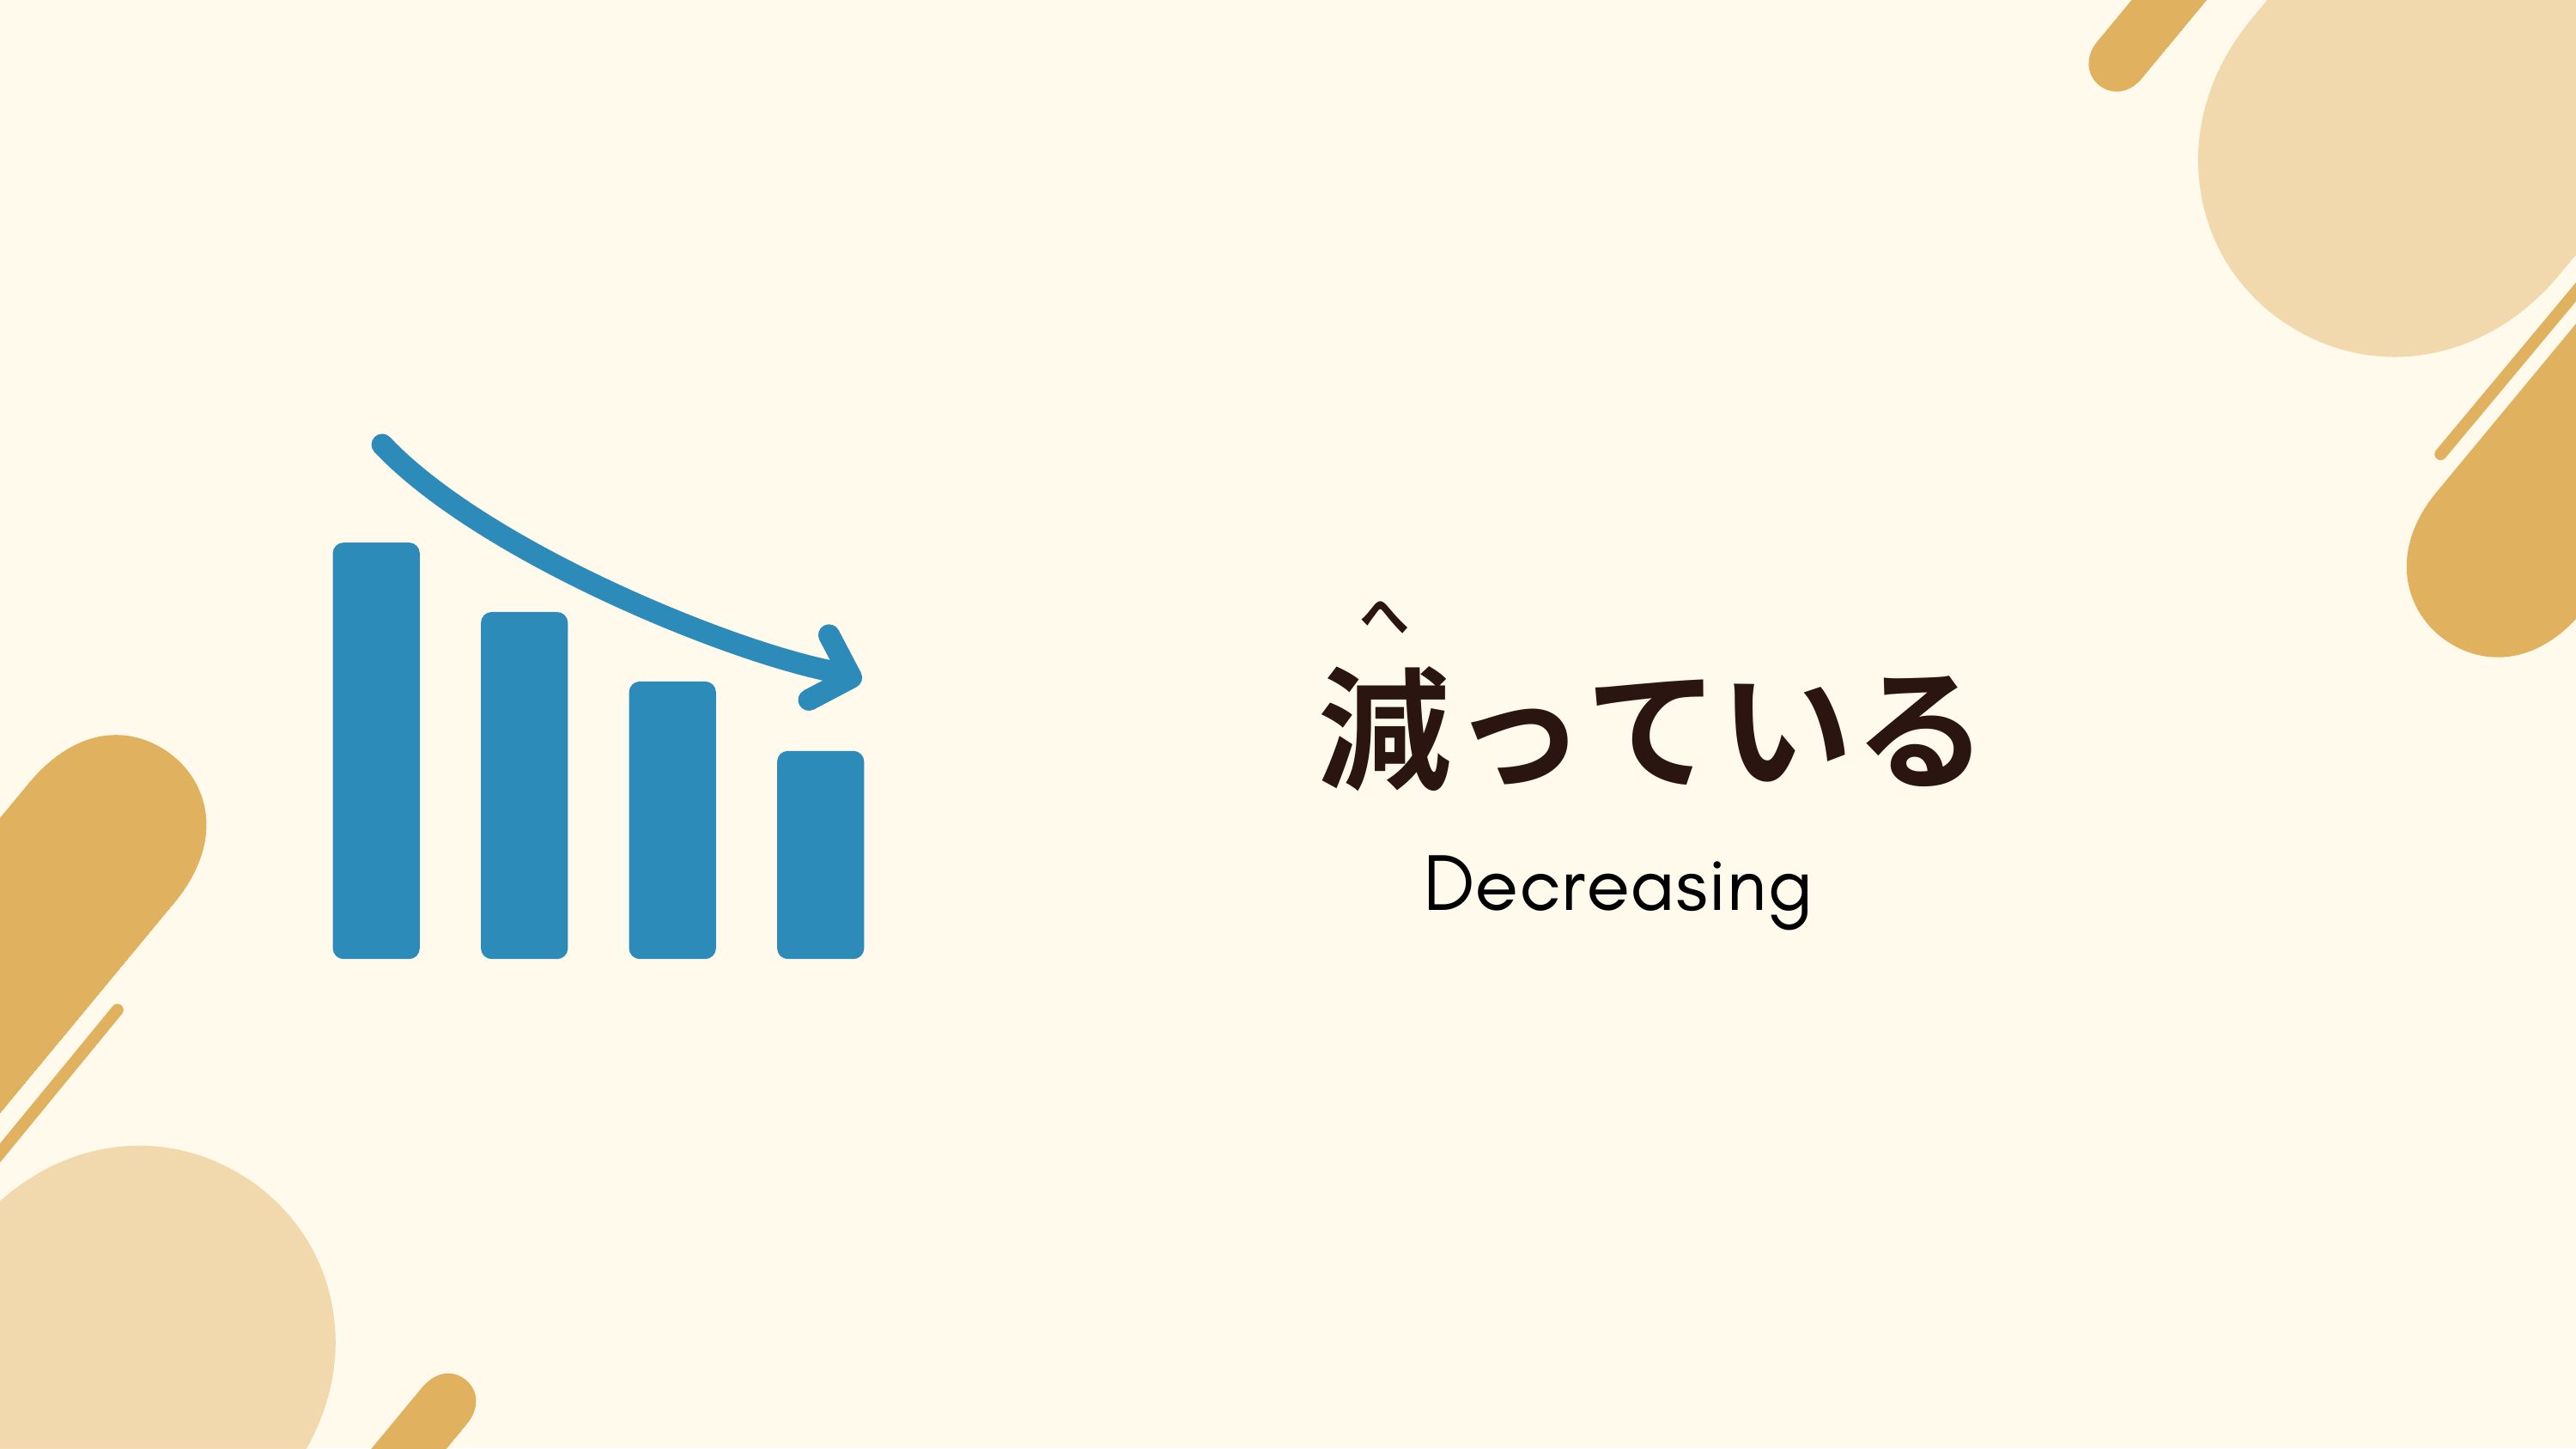
減っている
減っている
EN Decreasing
หน้า 18
คลิกเพื่อขยาย
JPへ
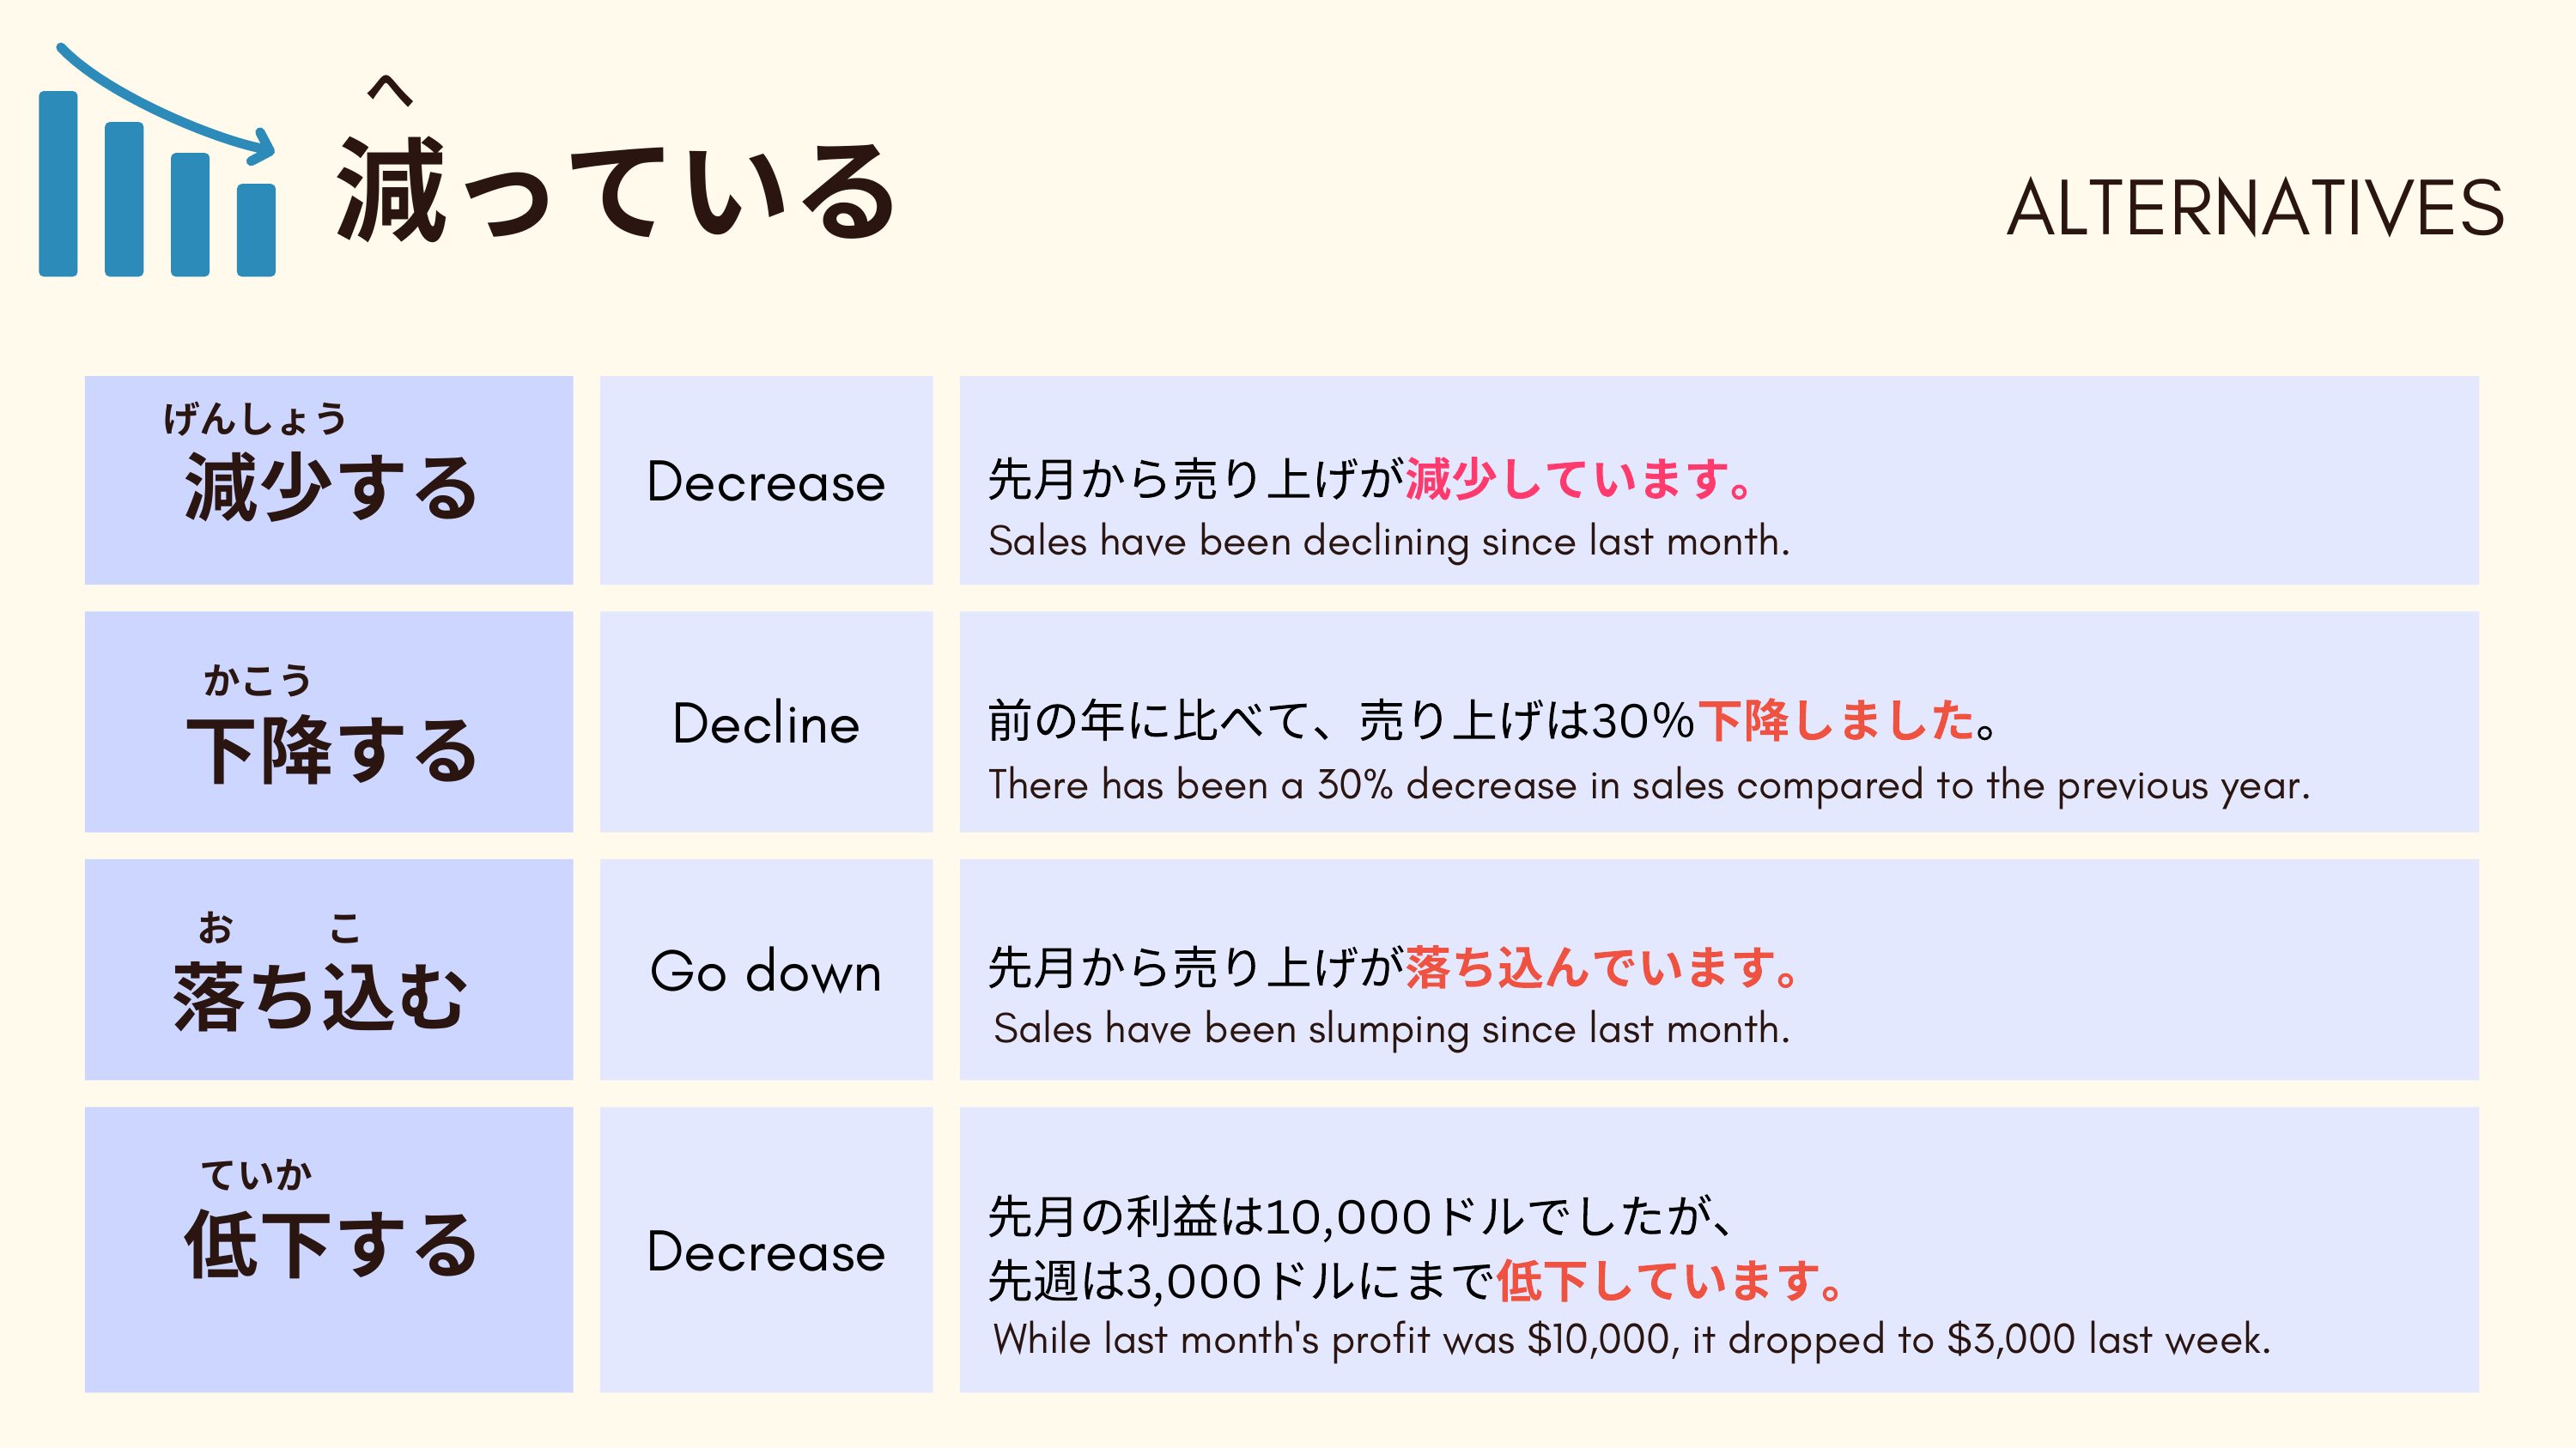
EN 減っている ALTERNATIVES
JPげんしょう
減少するDecrease先月から売り上げが減少しています。
減少するDecrease先月から売り上げが減少しています。
EN Sales have been declining since last month.
JPかこう
下降するDecline前の年に比べて、売り上げは30%下降しました。
下降するDecline前の年に比べて、売り上げは30%下降しました。
EN There has been a 30% decrease in sales compared to the previous year.
JPお
落ち込む
こ
Godown先月から売り上げが落ち込んでいます。
落ち込む
こ
Godown先月から売り上げが落ち込んでいます。
EN Sales have been slumping since last month.
JPていか
低下する
先月の利益は10,000ドルでしたが、
Decrease先週は3,000ドルにまで低下しています。
低下する
先月の利益は10,000ドルでしたが、
Decrease先週は3,000ドルにまで低下しています。
EN While last month's profit was $10,000, it dropped to $3,000 last week.
หน้า 19
คลิกเพื่อขยาย
JPぞうげんていどようす
増減の程度・様子
増減の程度・様子
ENDegree and Patterns of Increase/Decrease
หน้า 20
คลิกเพื่อขยาย
JPぞうげんていどようす
増減の程度・様子
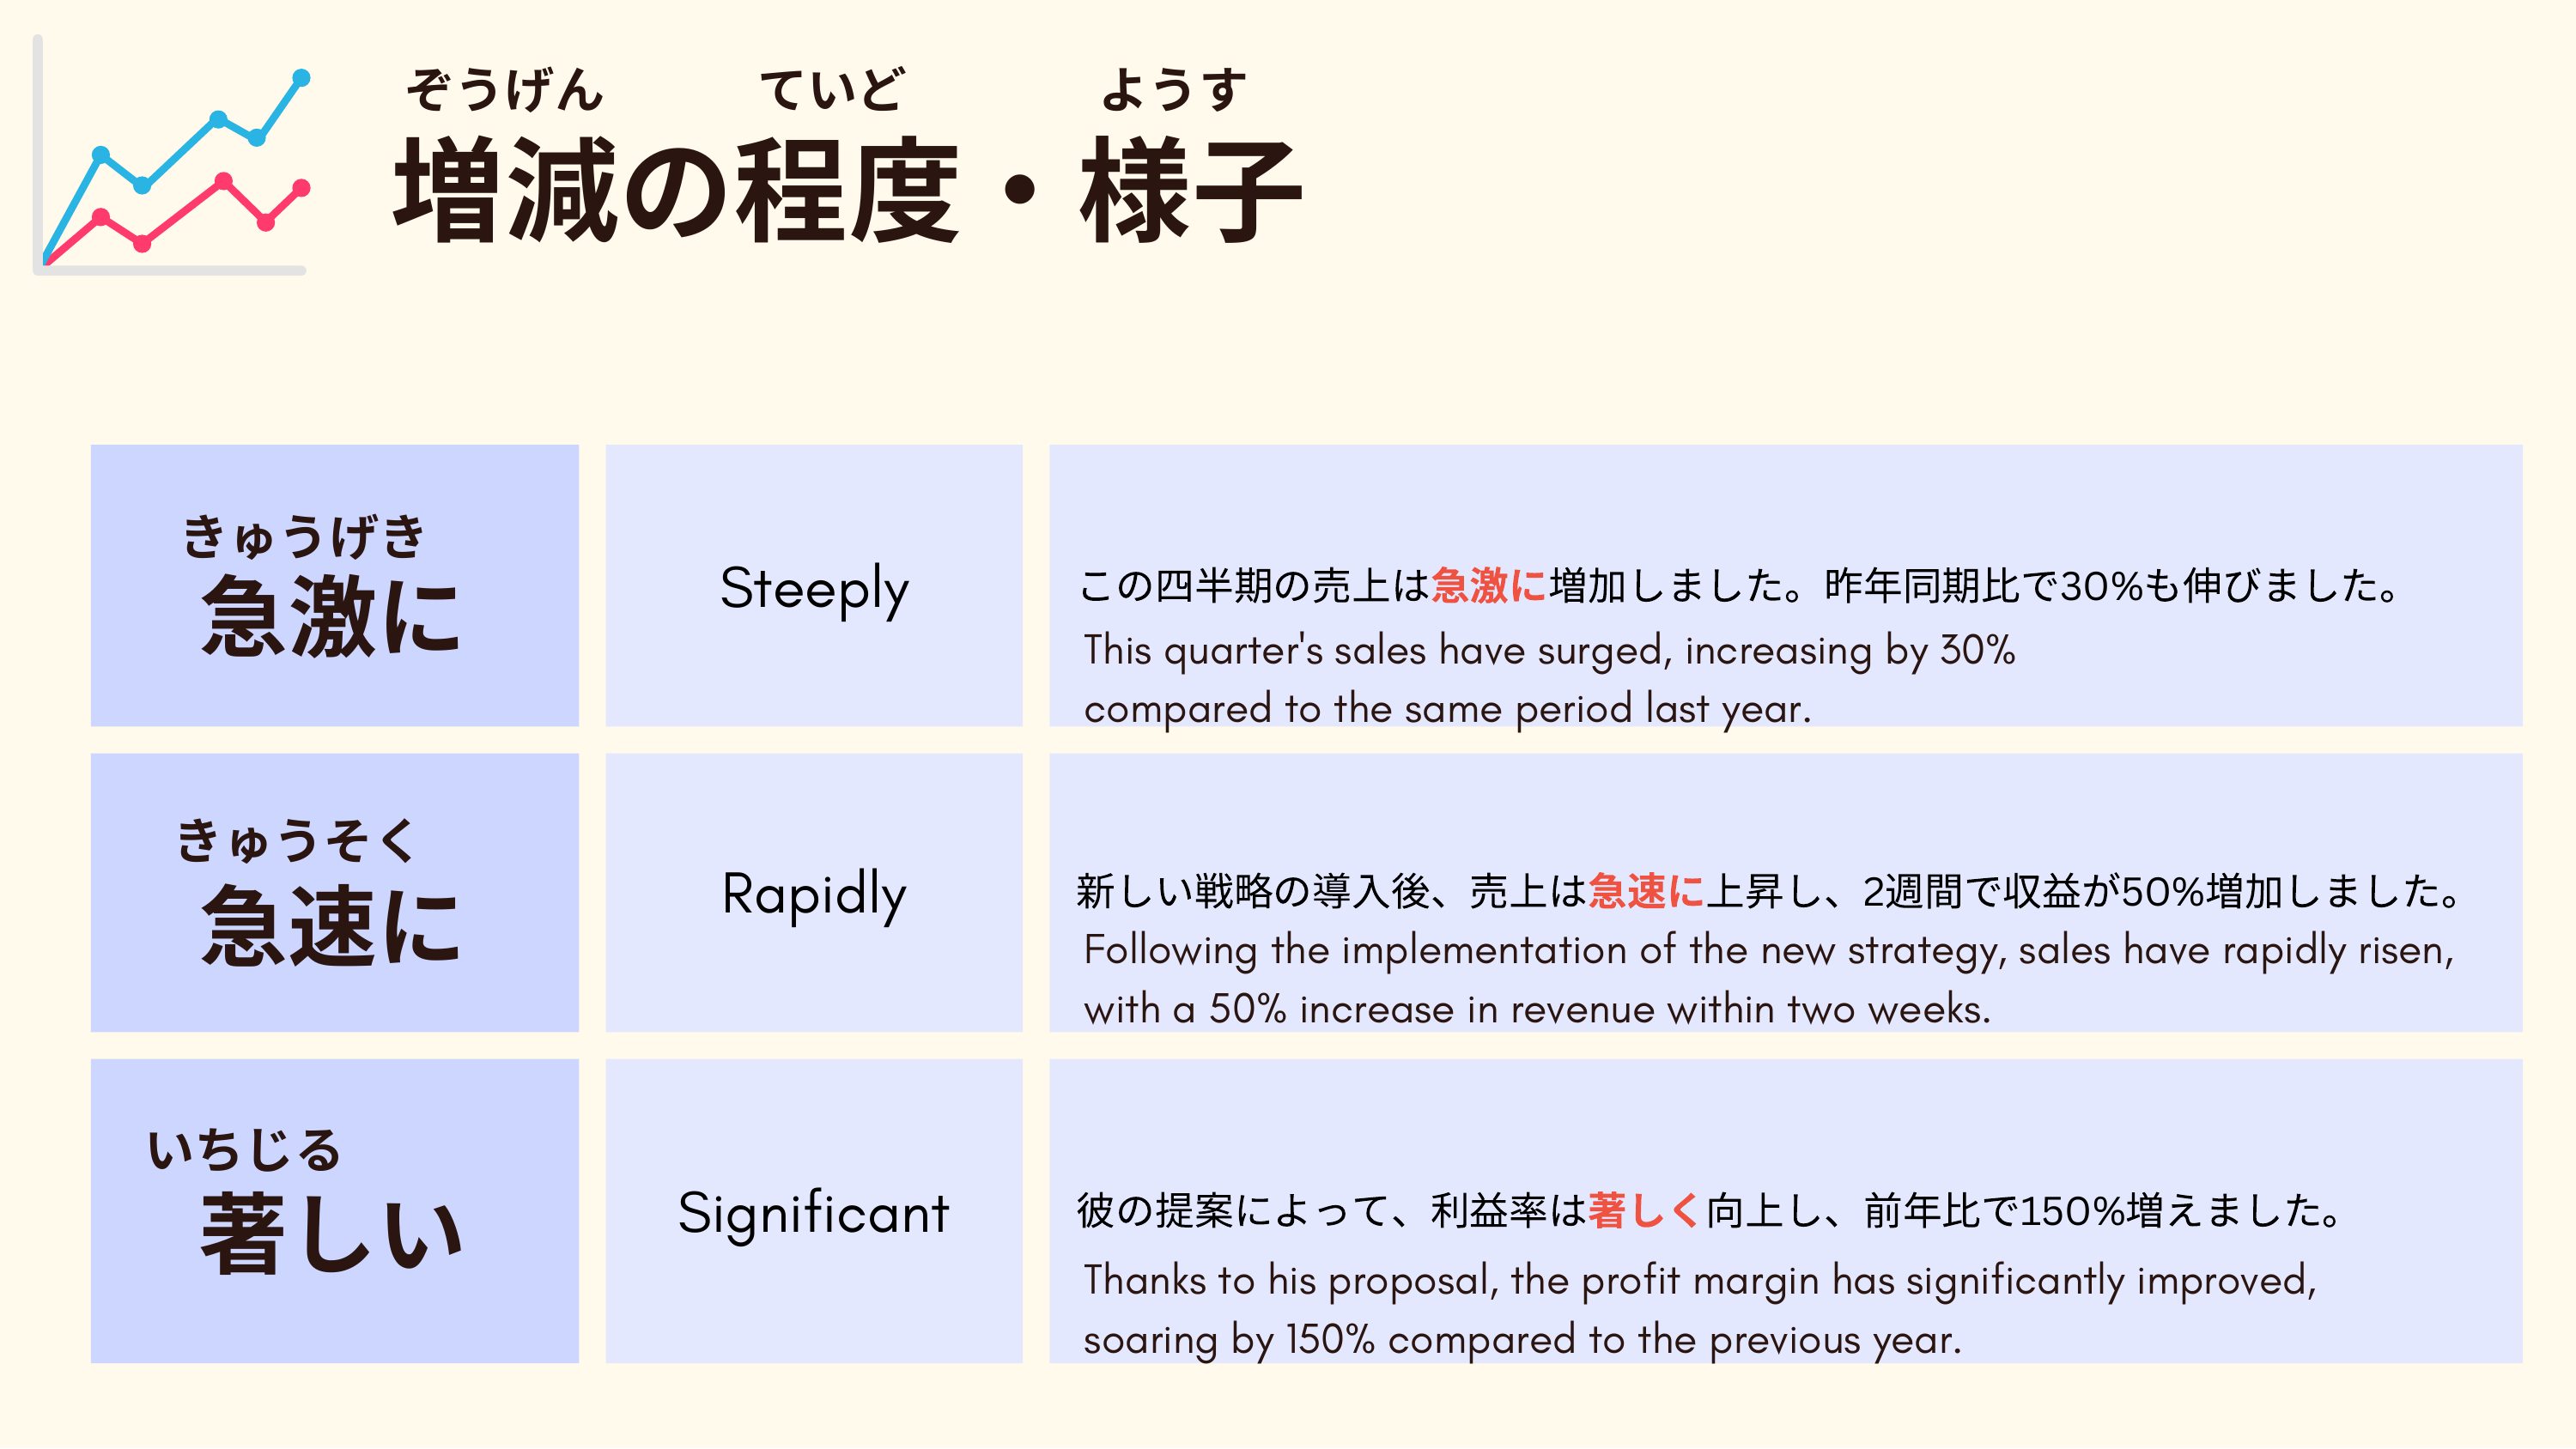
きゅうげき
この四半期の売上は急激に増加しました。昨年同期比で30%も伸びました。
増減の程度・様子
きゅうげき
この四半期の売上は急激に増加しました。昨年同期比で30%も伸びました。
EN 急激に Steeply
This quarter's sales have surged, increasing by 30%
compared to the same period last year.
This quarter's sales have surged, increasing by 30%
compared to the same period last year.
JPきゅうそく
新しい戦略の導入後、売上は急速に上昇し、2週間で収益が50%増加しました。
急速に
新しい戦略の導入後、売上は急速に上昇し、2週間で収益が50%増加しました。
急速に
EN Rapidly
Following the implementation of the new strategy, sales have rapidly risen,
with a 50% increase in revenue within two weeks.
Following the implementation of the new strategy, sales have rapidly risen,
with a 50% increase in revenue within two weeks.
JPいちじる
彼の提案によって、利益率は著しく向上し、前年比で150%増えました。
彼の提案によって、利益率は著しく向上し、前年比で150%増えました。
EN 著しい Significant
Thanks to his proposal, the profit margin has significantly improved,
soaring by 150% compared to the previous year.
Thanks to his proposal, the profit margin has significantly improved,
soaring by 150% compared to the previous year.
หน้า 21
คลิกเพื่อขยาย
JPぞうげんていどようす
増減の程度・様子
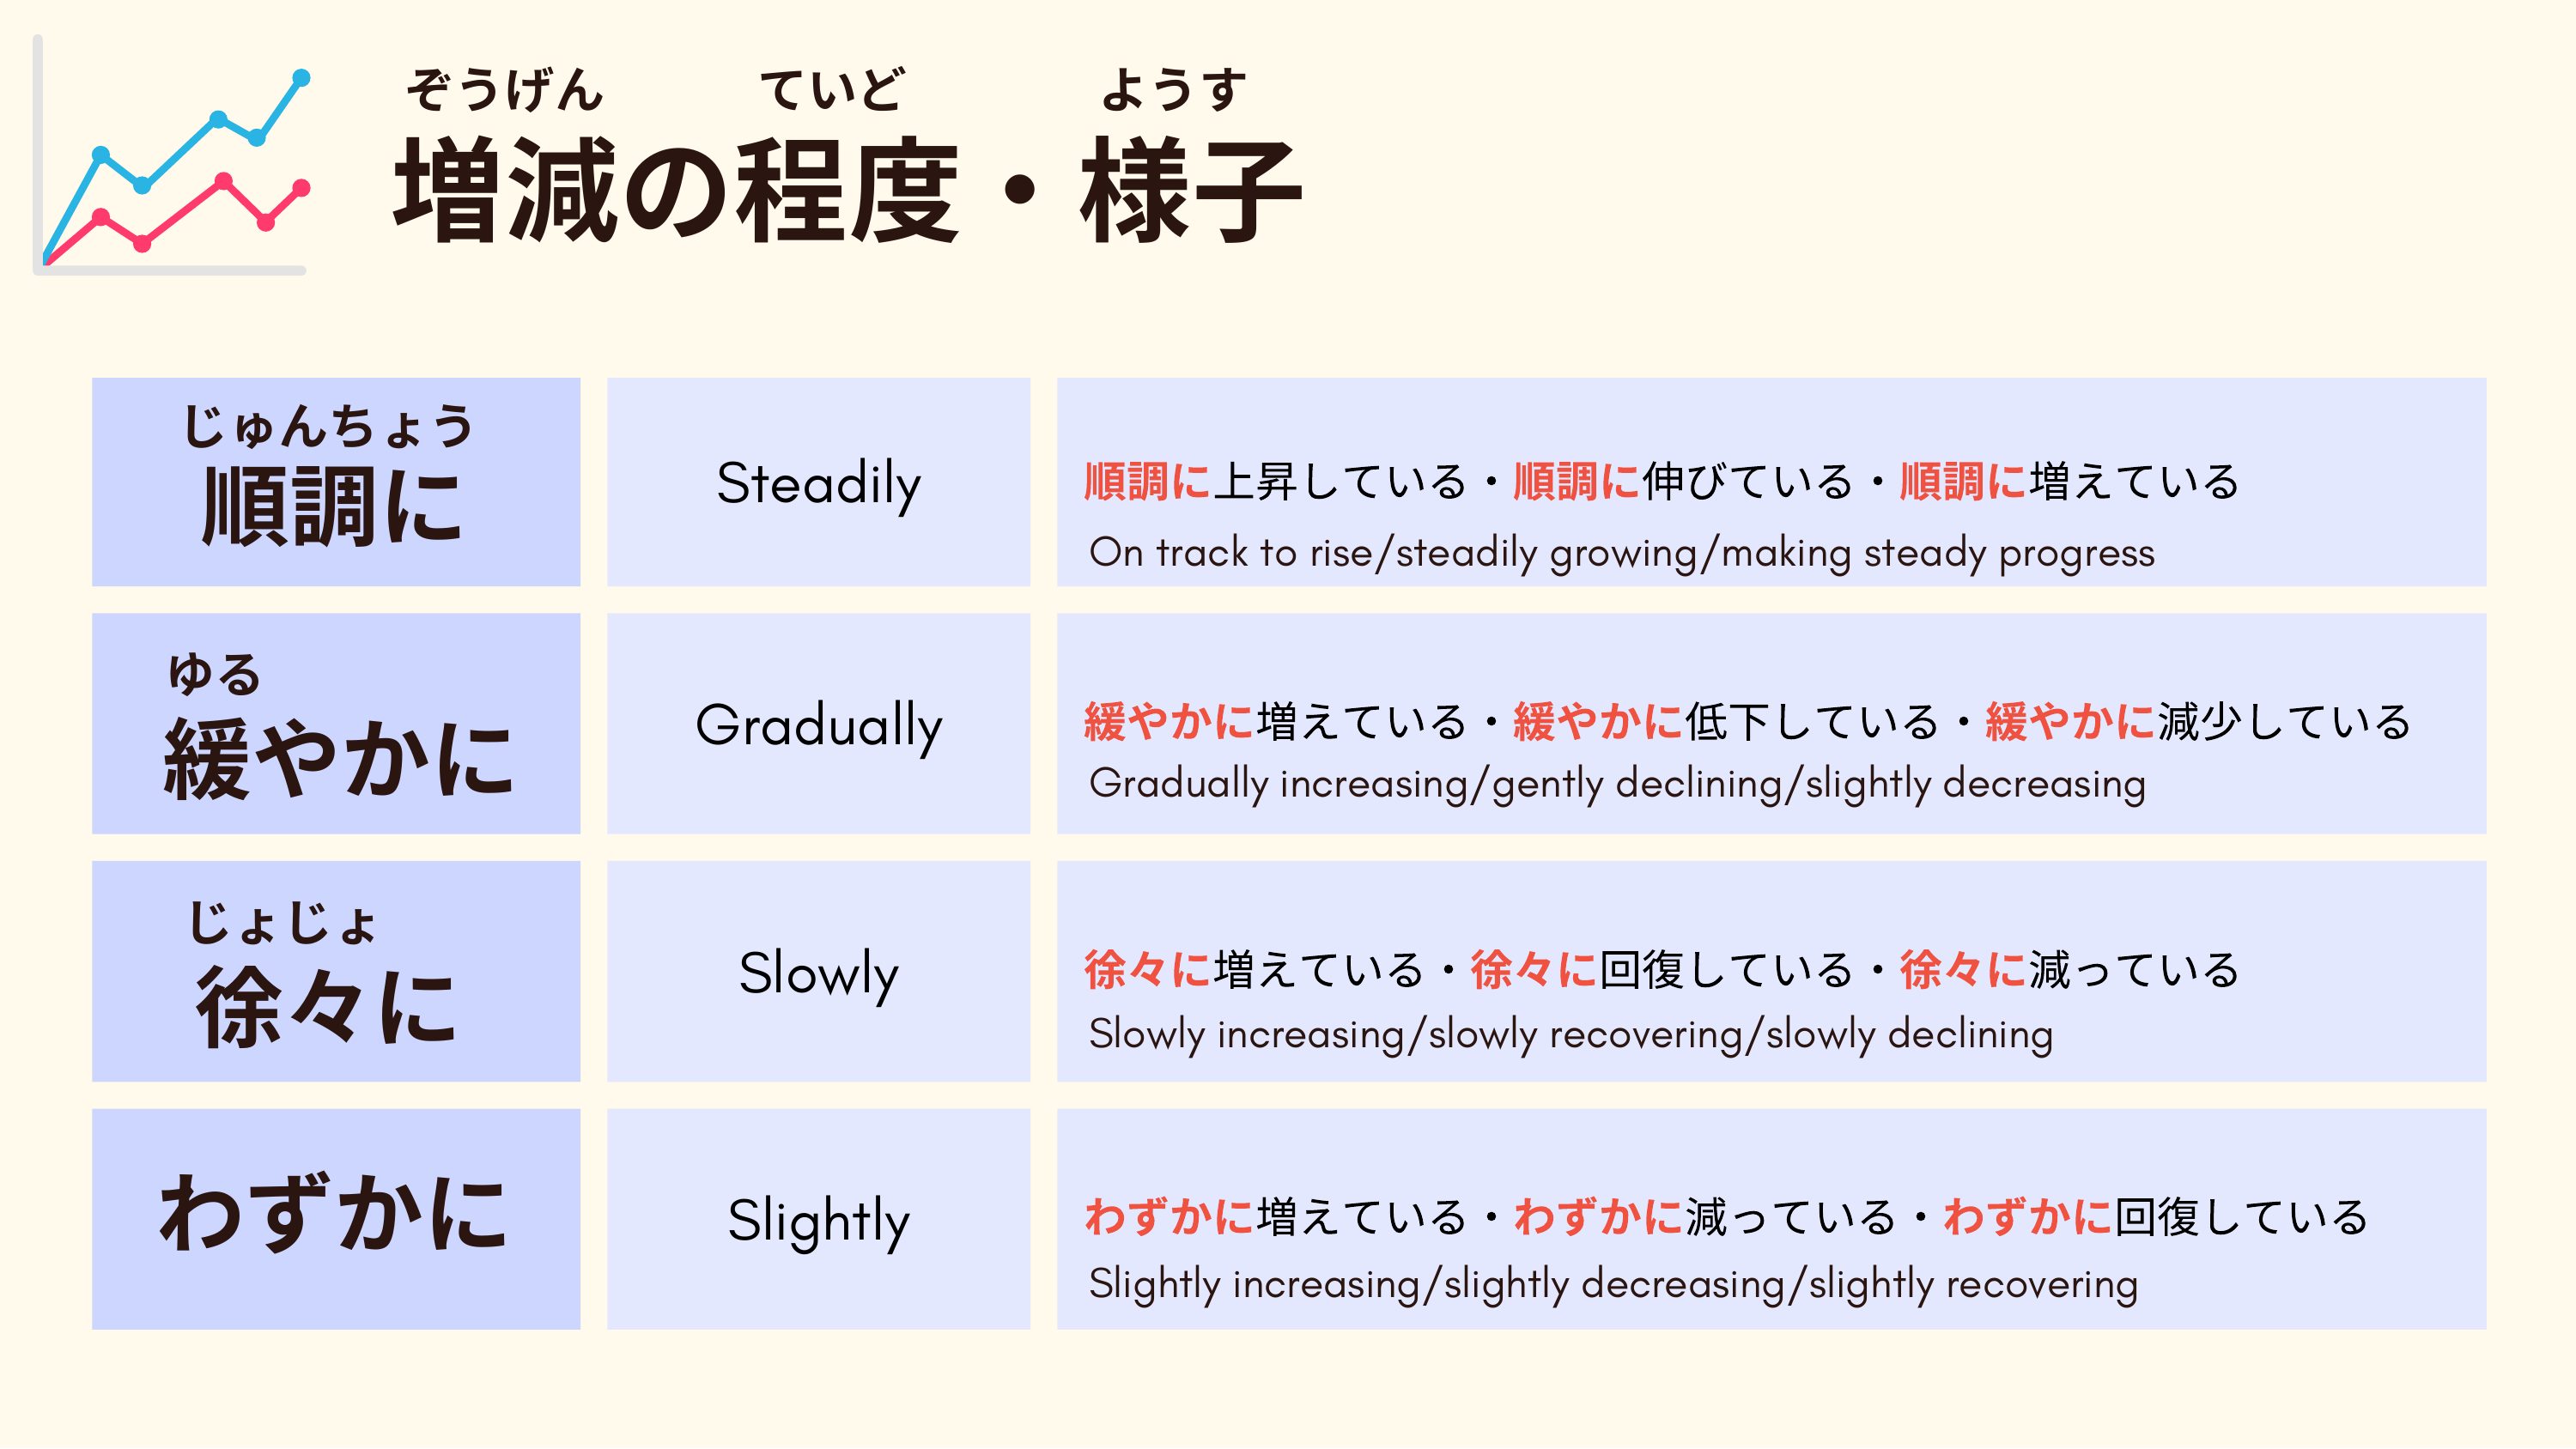
じゅんちょう
順調にSteadily順調に上昇している・順調に伸びている・順調に増えている
増減の程度・様子
じゅんちょう
順調にSteadily順調に上昇している・順調に伸びている・順調に増えている
EN On track to rise/steadily growing/making steady progress
JPゆる
Gradually緩やかに増えている・緩やかに低下している・緩やかに減少している
Gradually緩やかに増えている・緩やかに低下している・緩やかに減少している
EN緩やかに Gradually increasing/gently declining/slightly decreasing
JPじょじょ
Slowly徐々に増えている・徐々に回復している・徐々に減っている
Slowly徐々に増えている・徐々に回復している・徐々に減っている
EN徐々に Slowly increasing/slowly recovering/slowly declining
JPわずかにSlightlyわずかに増えている・わずかに減っている・わずかに回復している
EN Slightly increasing/slightly decreasing/slightly recovering
หน้า 22
คลิกเพื่อขยาย
JPぞうげんていどようす
増減の程度・様子
増減の程度・様子
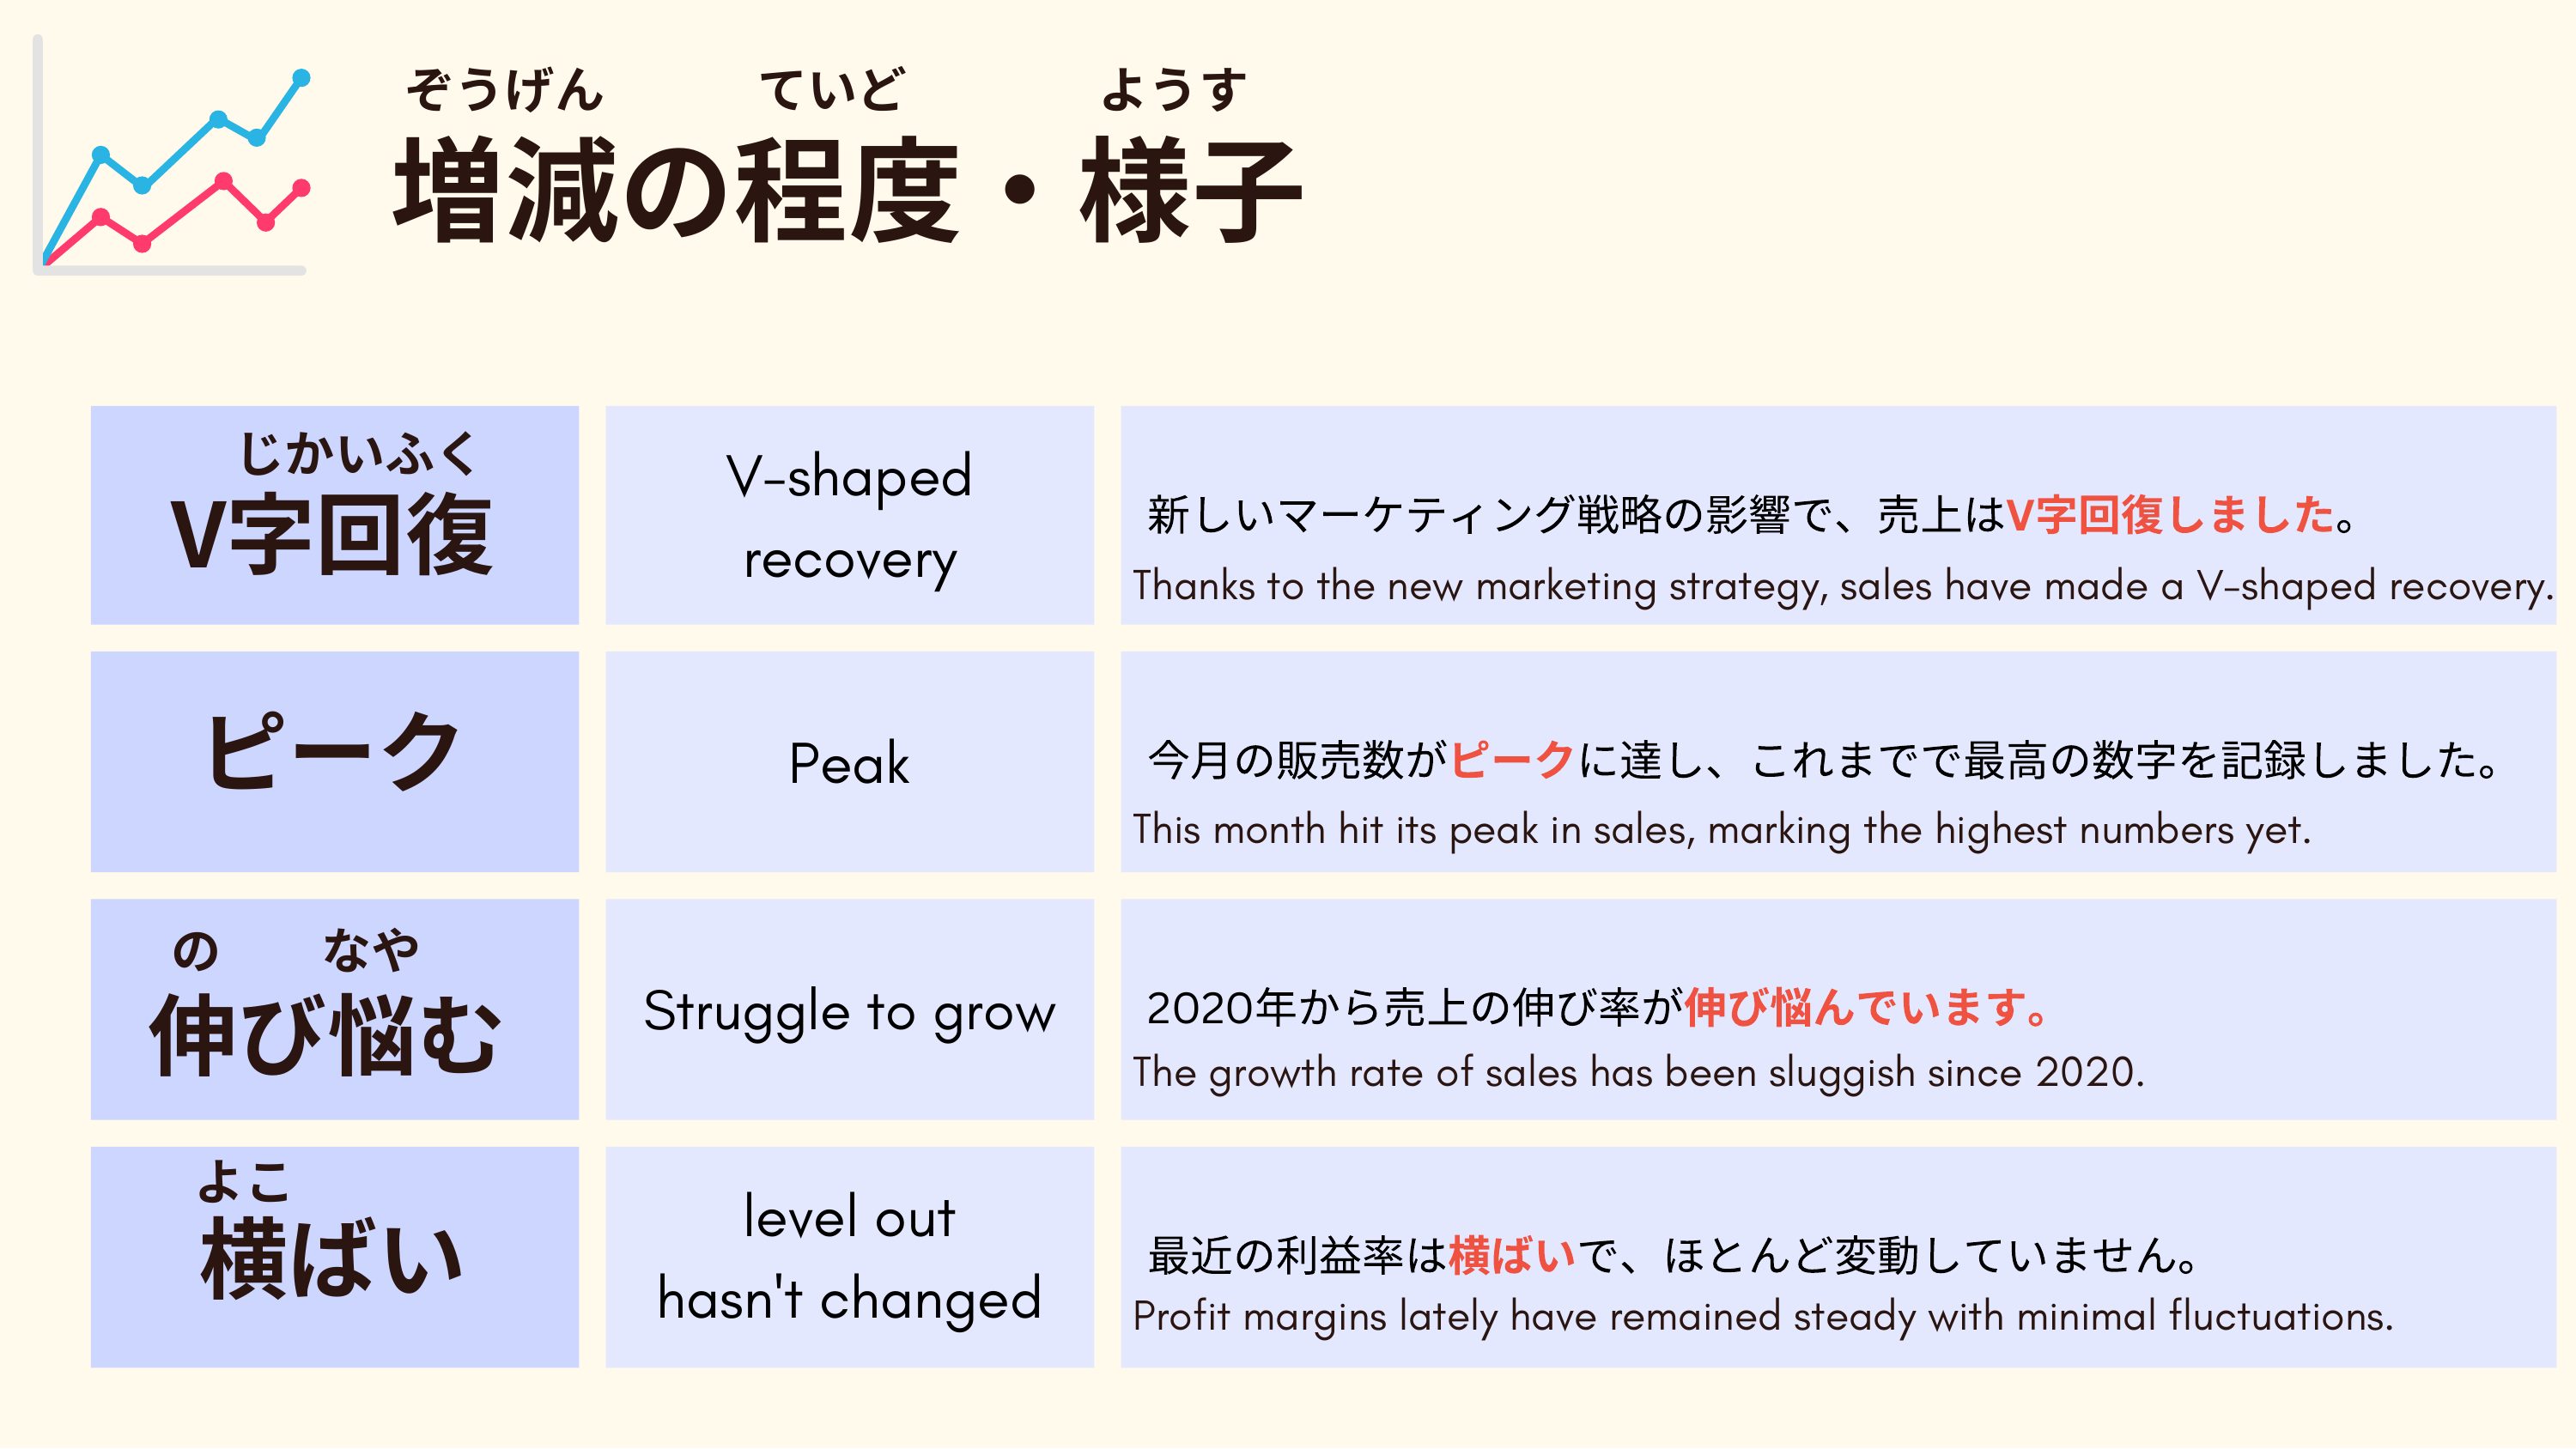
EN じかいふく V-shaped
JPV字回復新しいマーケティング戦略の影響で、売上はV字回復しました。
EN recovery Thanks to the new marketing strategy, sales have made a V-shaped recovery.
JPピークPeak今月の販売数がピークに達し、これまでで最高の数字を記録しました。
EN This month hit its peak in sales, marking the highest numbers yet.
JPのなや
年から売上の伸び率が伸び悩んでいます。
年から売上の伸び率が伸び悩んでいます。
EN伸び悩む Struggle to grow 2020
The growth rate of sales has been sluggish since 2020.
The growth rate of sales has been sluggish since 2020.
JPよこ
EN level out
横ばい hasn't changed
横ばい hasn't changed
JP最近の利益率は横ばいで、ほとんど変動していません。
EN Profit margins lately have remained steady with minimal fluctuations.
หน้า 23

คลิกเพื่อขยาย
JP動詞
ENVerb
หน้า 24
คลิกเพื่อขยาย
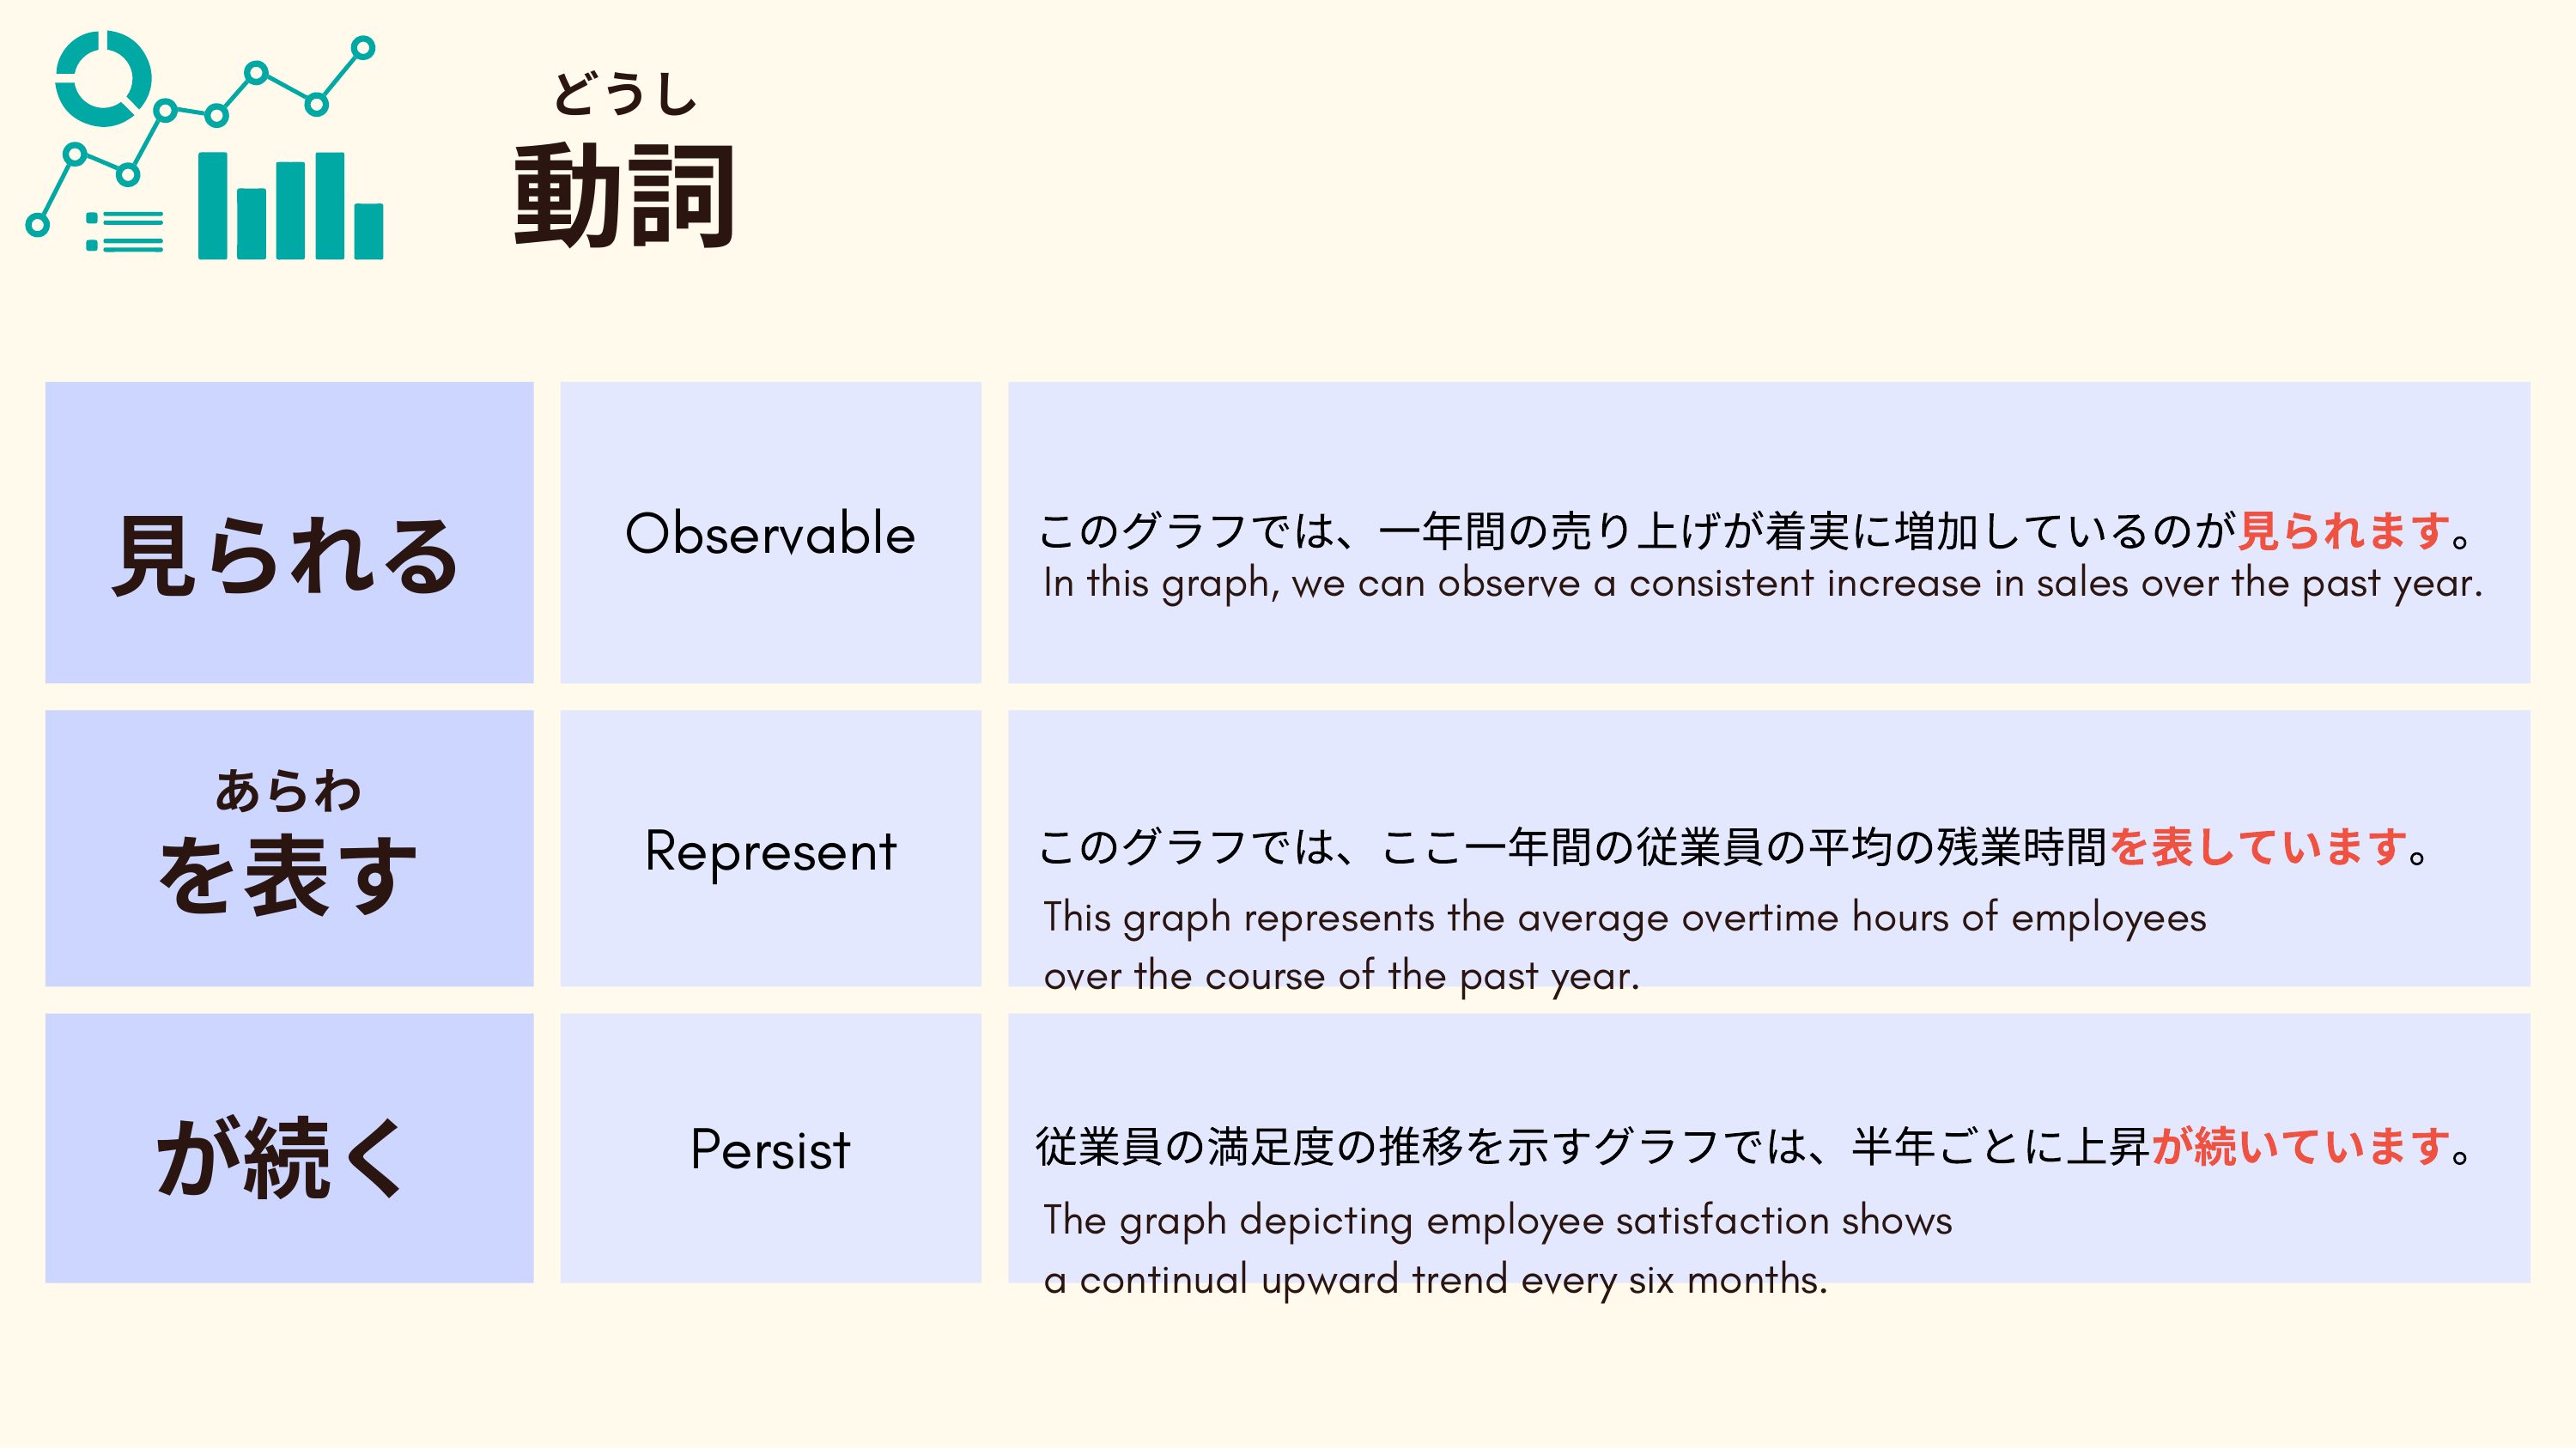
JPどうし
動詞
見られるObservableこのグラフでは、一年間の売り上げが着実に増加しているのが見られます。
動詞
見られるObservableこのグラフでは、一年間の売り上げが着実に増加しているのが見られます。
EN In this graph, we can observe a consistent increase in sales over the past year.
JPあらわ
このグラフでは、ここ一年間の従業員の平均の残業時間を表しています。
このグラフでは、ここ一年間の従業員の平均の残業時間を表しています。
ENを表す Represent
This graph represents the average overtime hours of employees
over the course of the past year.
This graph represents the average overtime hours of employees
over the course of the past year.
JPが続くPersist従業員の満足度の推移を示すグラフでは、半年ごとに上昇が続いています。
EN The graph depicting employee satisfaction shows
a continual upward trend every six months.
a continual upward trend every six months.